How to Evaluate Location Before Buying a Dental Practice
Co-Founder, Minty Dental

In Summary
- Population density, age distribution, median household income, insurance coverage rates, and population growth trends determine whether a location can support your debt service and income goals
- High-income areas with private insurance support fee-for-service models and elective procedures, while markets with high Medicaid enrollment require different financial structures and lower reimbursement expectations
- Age demographics shape service demand—family-dense suburbs favor pediatric care, while aging populations create demand for restorative work
- Most demographic research can be completed using free resources like U.S. Census data, county health departments, and ADA reports before hiring consultants
Location Demographics Reveal Whether the Market Can Support Your Investment
Location analysis confirms the practice sits in a demographic environment that can sustain your debt service and income goals. The answer sits in five core variables: population density, age distribution, median household income, insurance coverage rates, and population growth trends. Pull these data points early—most are available through free U.S. Census tools and county health departments—before you spend money on consultants.
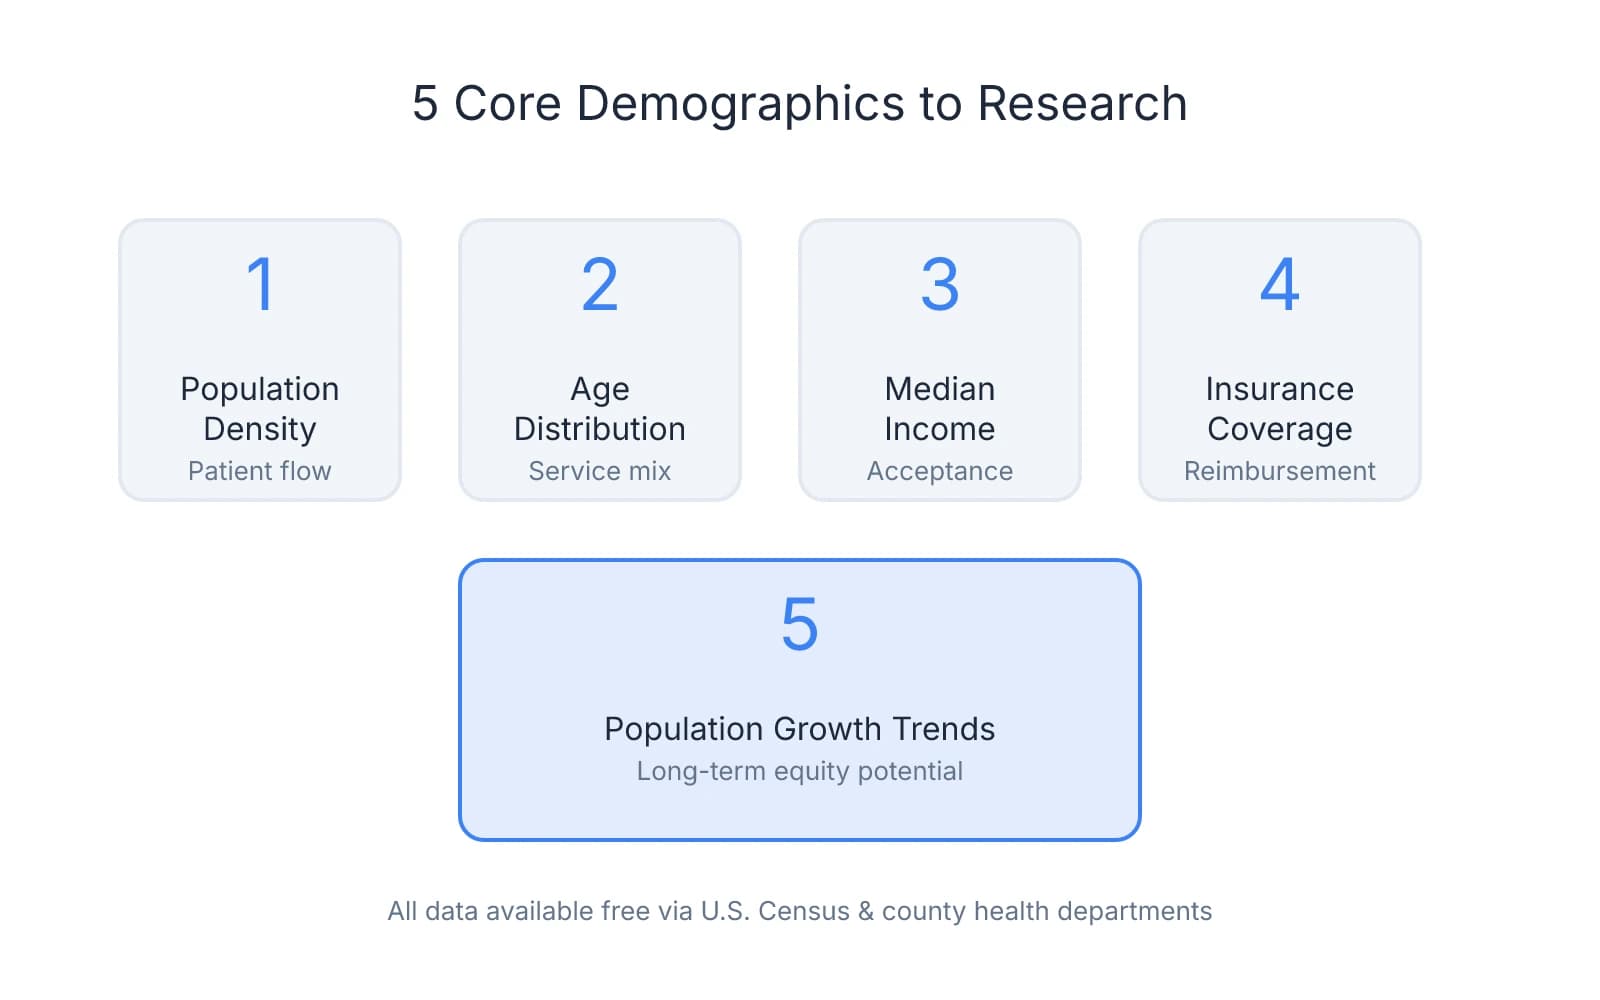
Population density determines baseline patient flow potential. Urban markets offer larger pools but higher competition—practices draw from smaller geographic radii because patients have more options. Rural markets require more aggressive marketing but face lighter competition. Suburban growth corridors often hit a sweet spot—enough density to support volume without city-center saturation.
Age demographics shape service mix demand. Family-dense suburbs support pediatric and hygiene-driven practices. Aging populations create demand for restorative work, crown and bridge, and geriatric services. If the practice built revenue on pediatric services but the area is aging out, you're looking at a mismatch requiring either a service pivot or patient acquisition strategy.
Median household income directly impacts treatment acceptance rates. High-income areas support fee-for-service models, elective procedures, and cosmetic work. Lower-income markets lean heavier on insurance-driven care with more price sensitivity. Pull median household income data for the ZIP codes your practice serves and compare it against current service mix. If the area skews lower-income but revenue depends on high-margin elective work, that's a red flag.
Insurance coverage rates determine reimbursement levels and patient affordability. Areas with high private insurance coverage support better reimbursement and lower accounts receivable risk. Markets with high Medicaid enrollment require different financial models—lower reimbursement rates, higher patient volume to hit revenue targets, and more administrative overhead. If you're evaluating a practice with mostly Medicaid patients, the location's insurance mix becomes critical in your financial projections.
Population growth trends indicate whether the market is expanding or contracting. Buying into a shrinking market limits long-term equity growth regardless of current performance. Pull the data yourself during due diligence—it's the first line of defense against overpaying for a practice in a mismatched or declining market.
How to Calculate Dentist-to-Population Ratios and Competitive Saturation
The traditional benchmark—one dentist per 2,000 to 2,500 people—misses the nuance that determines whether a market is actually saturated. What matters more is the concentration of core patients: people with private insurance, household income above $50,000, and a history of regular dental utilization. A market with 3,000 people per dentist might look undersaturated until you realize half the population is uninsured or relies on Medicaid.
The framework that works: conduct a multi-radius analysis around the practice location, count active competitors within each zone, and filter population data to estimate core patients per dentist.
Map Competing Practices in Three Radii
Define the practice's patient draw area. Urban practices typically pull from 1-3 miles. Suburban practices draw from 3-5 miles. Rural practices can pull from 10+ miles. Use Google Maps to drop a pin at the practice address, then draw circles at 1 mile, 3 miles, and 5 miles.
Within each radius, count active general dentists and specialists. Use your state dental board's online directory to pull licensed providers by ZIP code, then cross-reference with Google Maps to confirm they're still practicing. Mark each competitor and note whether they're general dentistry, pediatric, orthodontic, or specialty-focused.
One pattern many buyers overlook: high competition isn't always a red flag. If you're seeing 15-20 practices within 3 miles but the area is growing and median income is strong, that density signals demand, not saturation. The risk is heavy competition in a stagnant or declining market.
Calculate Core Patients Per Dentist
Pull population data for ZIP codes within your target radius using U.S. Census American Community Survey data. Look for households with private health insurance coverage and median household income above $50,000.
Multiply the filtered population by an estimated dental utilization rate—research suggests around 64% of adults visit a dentist annually. Divide that number by the count of general dentists in the radius. If you're landing around 400-500 core patients per dentist, the market has room. Below 300 suggests saturation. Above 600 indicates opportunity.
For example: A 3-mile radius with 25,000 people, 60% private insurance coverage, and median income of $65,000 gives you roughly 15,000 core patients. At 64% utilization, that's 9,600 active dental patients. With 20 general dentists in the area, you're looking at 480 core patients per dentist—a healthy ratio suggesting the market can support growth.
Assess Competitor Service Mix for Gaps
Raw dentist counts don't tell you what services are already saturated. Pull competitor websites and Google Business listings to see what services they emphasize. If you're noticing a gap—like no pediatric-focused practices in a family-dense suburb—that's a niche worth exploring.
Where this gets tricky: some gaps exist because demand isn't there. Cross-check service gaps against income and insurance data before assuming you've found an underserved market.
Recognize When Competition Signals Demand
High dentist density in a growing area often means strong patient demand, not oversupply. If you're seeing new practices open, established practices expanding, and population growth trends pointing up, competition is a sign the market is healthy.
One protection many buyers find valuable: talk to local specialists and ask about referral patterns. If general dentists are busy enough to refer out complex cases, that's a signal the market is active. If specialists are struggling to get referrals, that's a warning sign that general dentists are fighting for volume.
Where to Find Free and Low-Cost Demographic Data for Location Research
The data you need to screen markets and validate fundamentals is available for free or low cost. Start with public databases to build your baseline understanding, then invest in paid reports only when you're serious about a specific practice.
U.S. Census Bureau (data.census.gov) is your starting point for population, income, age distribution, and household composition. Pull data by ZIP code, county, or census tract. Look for total population, median household income, age brackets (especially 25-64), and household size. This gives you the baseline demographic profile in under 30 minutes.
American Community Survey (ACS) offers annual data on insurance coverage rates, employment sectors, education levels, and commuting patterns. Insurance coverage data is particularly valuable: you can see what percentage of the population has private coverage, employer-sponsored plans, Medicaid, or no insurance. High private insurance coverage correlates with better reimbursement and lower accounts receivable risk.
County Health Rankings (countyhealthrankings.org) publishes dentist-to-population ratios, uninsured rates, and health access metrics by county. This is where you can quickly benchmark competitive density without manually counting practices. The site also flags counties designated as dental health professional shortage areas (HPSAs).
ADA Health Policy Institute provides state-level dentist workforce data, Medicaid reimbursement rates, and dental care utilization trends. If you're comparing practices across state lines, this helps you understand regulatory and reimbursement differences that affect profitability. Medicaid reimbursement rates vary widely by state—what works financially in one market may not translate across the border.
Local and county health departments often publish community health needs assessments with oral health data, underserved area designations, and population health trends. Call the county health department or search "[County Name] community health assessment" to find the most recent report.
Where paid reports become worth it: once you're serious about a specific location and need competitor mapping, patient origin analysis, or service mix benchmarking. Firms like Henry Schein and practice brokers offer demographic reports for $500-$3,000 that layer proprietary data on top of Census figures. These aren't necessary for initial screening, but they can validate your assumptions before you commit to a purchase.
Start with free data to eliminate weak markets, then invest in paid analysis only when you've narrowed to a shortlist.
Red Flags and Green Flags: What the Data Should Tell You Before You Buy
The goal of demographic research is matching the practice's current model and your growth plans to the demographic reality. What matters is knowing which weaknesses you can manage and which ones will drain cash and limit equity growth.
Red Flags That Should Make You Pause
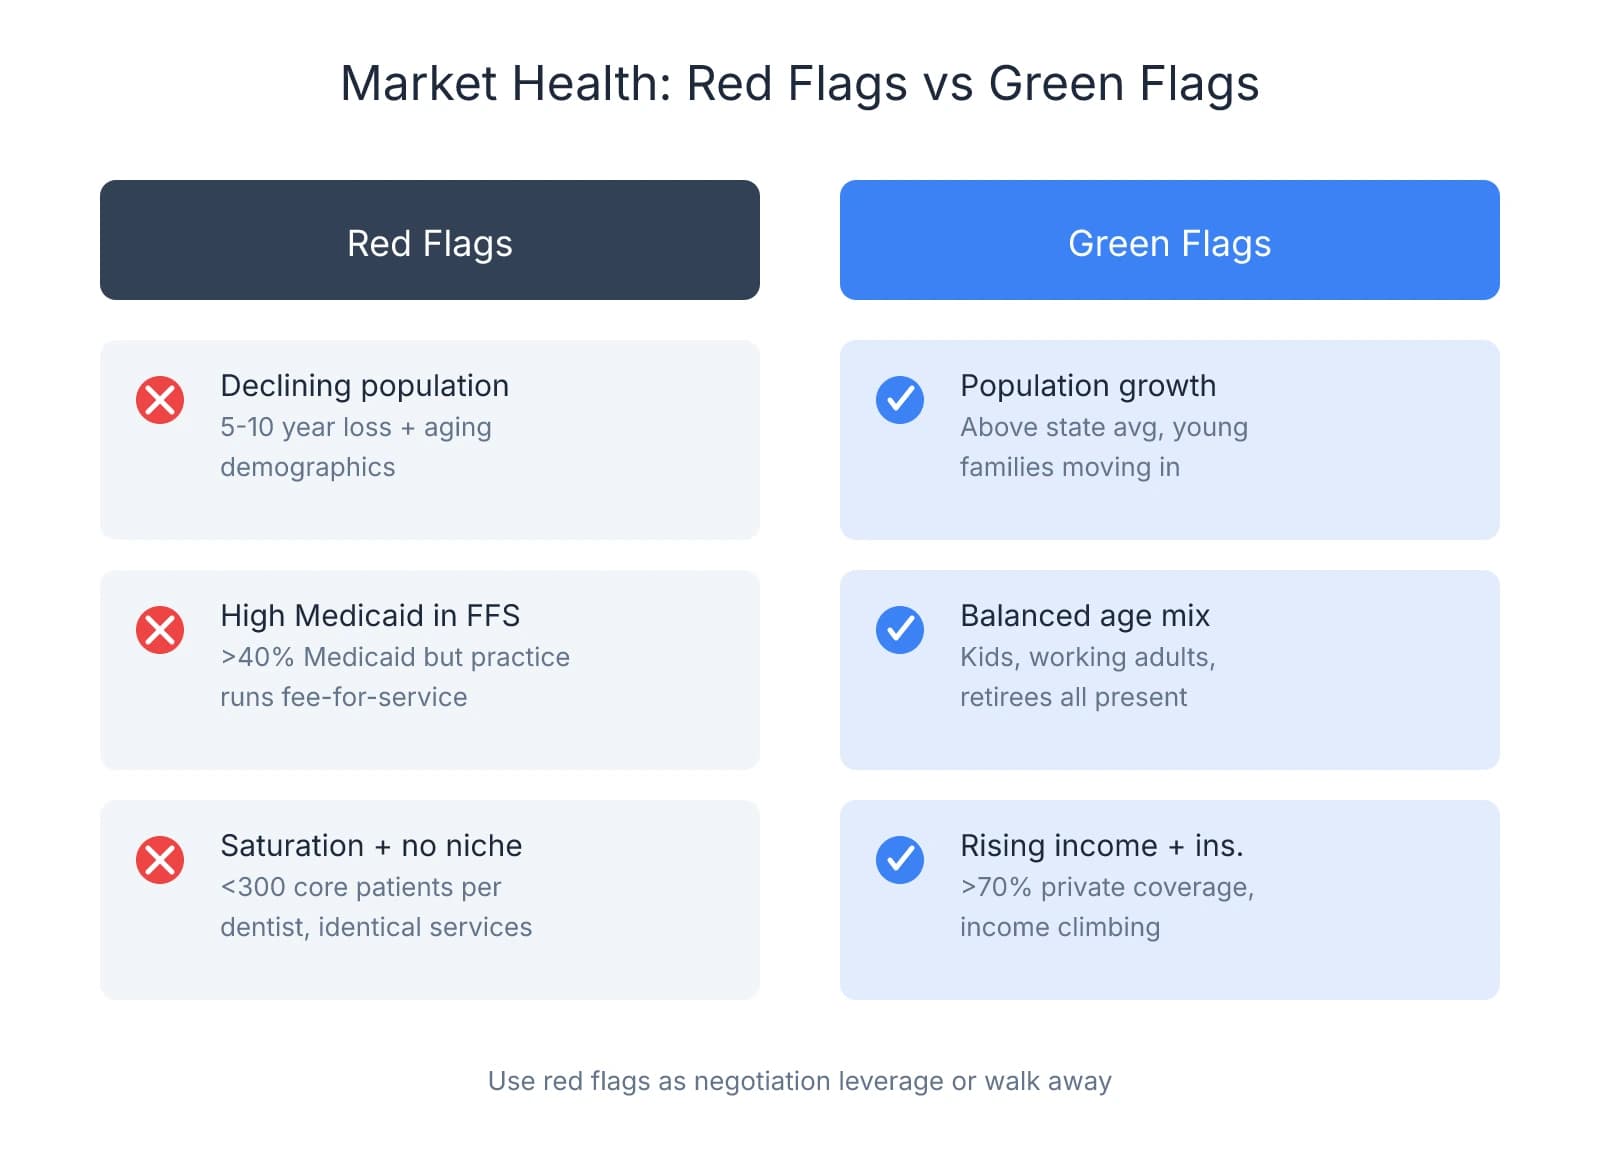
Declining population over 5-10 years, especially with aging demographics. If population data shows consistent loss and remaining residents are aging into retirement, you're buying into a shrinking patient pool with limited long-term acquisition potential. This caps practice value appreciation. One exception: if you're planning a lifestyle practice rather than growth-focused ownership, a declining market may still work—but price it accordingly.
High Medicaid enrollment in a fee-for-service practice. When more than 40% of the area's population relies on Medicaid but the practice operates fee-for-service or depends heavily on elective procedures, you're looking at a fundamental mismatch. Medicaid reimbursement rates are lower, treatment acceptance drops, and converting the practice requires operational changes most buyers aren't prepared for.
Extreme competitive saturation with no service differentiation. A ratio below 300 core patients per dentist signals oversupply, but the real risk is when that saturation exists alongside practices offering identical services. In saturated markets, differentiation or a specific underserved demographic creates room to grow.
Green Flags That Signal Strong Fundamentals
Population growth above state or national average, especially with in-migration of young families or working-age adults. Growth markets create tailwinds that make patient acquisition easier and practice value appreciation more likely. In-migration of families signals long-term stability—parents bring kids in for cleanings, sealants, and ortho consults, and they tend to stay in the area longer.
Balanced age distribution with a mix of children, working-age adults, and retirees. A market that skews too heavily toward one demographic creates dependency risk. The strongest locations show a spread across age brackets—enough kids to fill hygiene schedules, enough working-age adults for restorative and cosmetic work, and enough retirees to sustain crown and bridge volume.
Rising median household income and strong private insurance coverage. When median income is climbing and more than 70% of the population carries private insurance, treatment acceptance rates improve and reimbursement risk drops. High-income areas support fee-for-service models, elective procedures, and cosmetic work.
Use Demographic Weaknesses as Negotiation Leverage
If your research reveals a shrinking market, high Medicaid enrollment in a fee-for-service practice, or saturation without differentiation, that's leverage. Sellers price practices based on current performance, but if demographics show the market is working against long-term growth, you have justification to renegotiate the price or walk away.
You're not looking for perfection—you're confirming the market can support your debt service, income goals, and growth plans without requiring heroic effort. If the data shows tailwinds, you're buying with confidence. If it shows headwinds, you're either negotiating a better deal or moving on to a practice where the fundamentals work in your favor.
Sources & References
The data and claims in this article are drawn from the following sources. We prioritize government data, peer-reviewed research, and established industry publications to ensure accuracy.
- free U.S. Census tools— data.census.gov
- Dentist Workforce - American Dental Association— ada.orgIndustry
- Dentists | County Health Rankings & Roadmaps— countyhealthrankings.orgIndustry
- Dentist Workforce - American Dental Association— ada.orgIndustry
- Demographic Data Analysis, Reports for Dental Practices— dentalfinancial.henryschein.comIndustry
Frequently Asked Questions
Find Your Ideal Dental Practice Location
Location is crucial to practice success. Explore dental practices in thriving markets across the nation, or get expert guidance through our acquisition specialists who help you evaluate demographics and market potential.