Dental Practice Claim Denial Rate: How to Find and Fix It

Co-Founder, Minty Dental
In Summary
- Your claim denial rate is denied claims divided by total claims submitted. The industry average sits at 10–15%; well-run practices target 3–6%, and elite billing operations reach 2–3%.
- Rejections (bounced at the clearinghouse before adjudication) and denials (refused after payer review) are different problems with different fixes. Lumping them together hides where the real breakdowns are.
- Denial rate and net collection rate measure different failure points. A practice can have a high collection rate and still be hemorrhaging revenue through untracked denials.
- Up to 65% of denied claims are never resubmitted, which means untracked denials don't show up as a loss — they just quietly disappear from your revenue.
- 78% of dental practices reported increased denials or payer scrutiny in the past 12 months, so this problem is getting harder to ignore.
Your Claim Denial Rate Is a Measurable Number — Here's What It Tells You
Your dental practice claim denial rate is the percentage of submitted insurance claims that payers refuse to pay on first adjudication. Divide the number of denied claims by the total number of claims submitted in a given period, then multiply by 100. A practice that submits 500 claims in a month and receives 60 denials has a 12% denial rate.
That number is different from your net collection rate, which measures how much of your adjusted production you actually collect across all payment types, including patient balances. A practice can post a net collection rate of 92% and still be losing significant revenue through denials, because denied claims that are never resubmitted often get quietly written off rather than recovered. They measure different failure points in the revenue cycle, and you need both to see the full picture. If your collection rate already feels like a problem on its own, the leakage diagnostic for dental collections covers that separately.
Before you can interpret your denial rate accurately, you need to separate two things that most practice management systems lump together: rejections and denials. A rejection happens at the clearinghouse before the claim ever reaches the payer. It bounces back because of a missing field, a formatting error, or an invalid subscriber ID. Those are correctable within hours and usually don't represent a workflow problem so much as a data-entry one. A denial is different. The claim made it through the clearinghouse, was received and adjudicated by the payer, and was then refused. That refusal has a reason code attached to it, and fixing it may require additional documentation, a corrected claim, or a formal appeal. Practices that count rejections and denials in the same bucket can't see which problem is actually driving their numbers.
78% of dental practices reported an increase in claim denials or heightened payer scrutiny over the past 12 months, driven largely by tightening medical necessity standards and expanded frequency limitation enforcement. So if your team feels like denials are coming in faster than they used to, that matches what's happening across the industry.
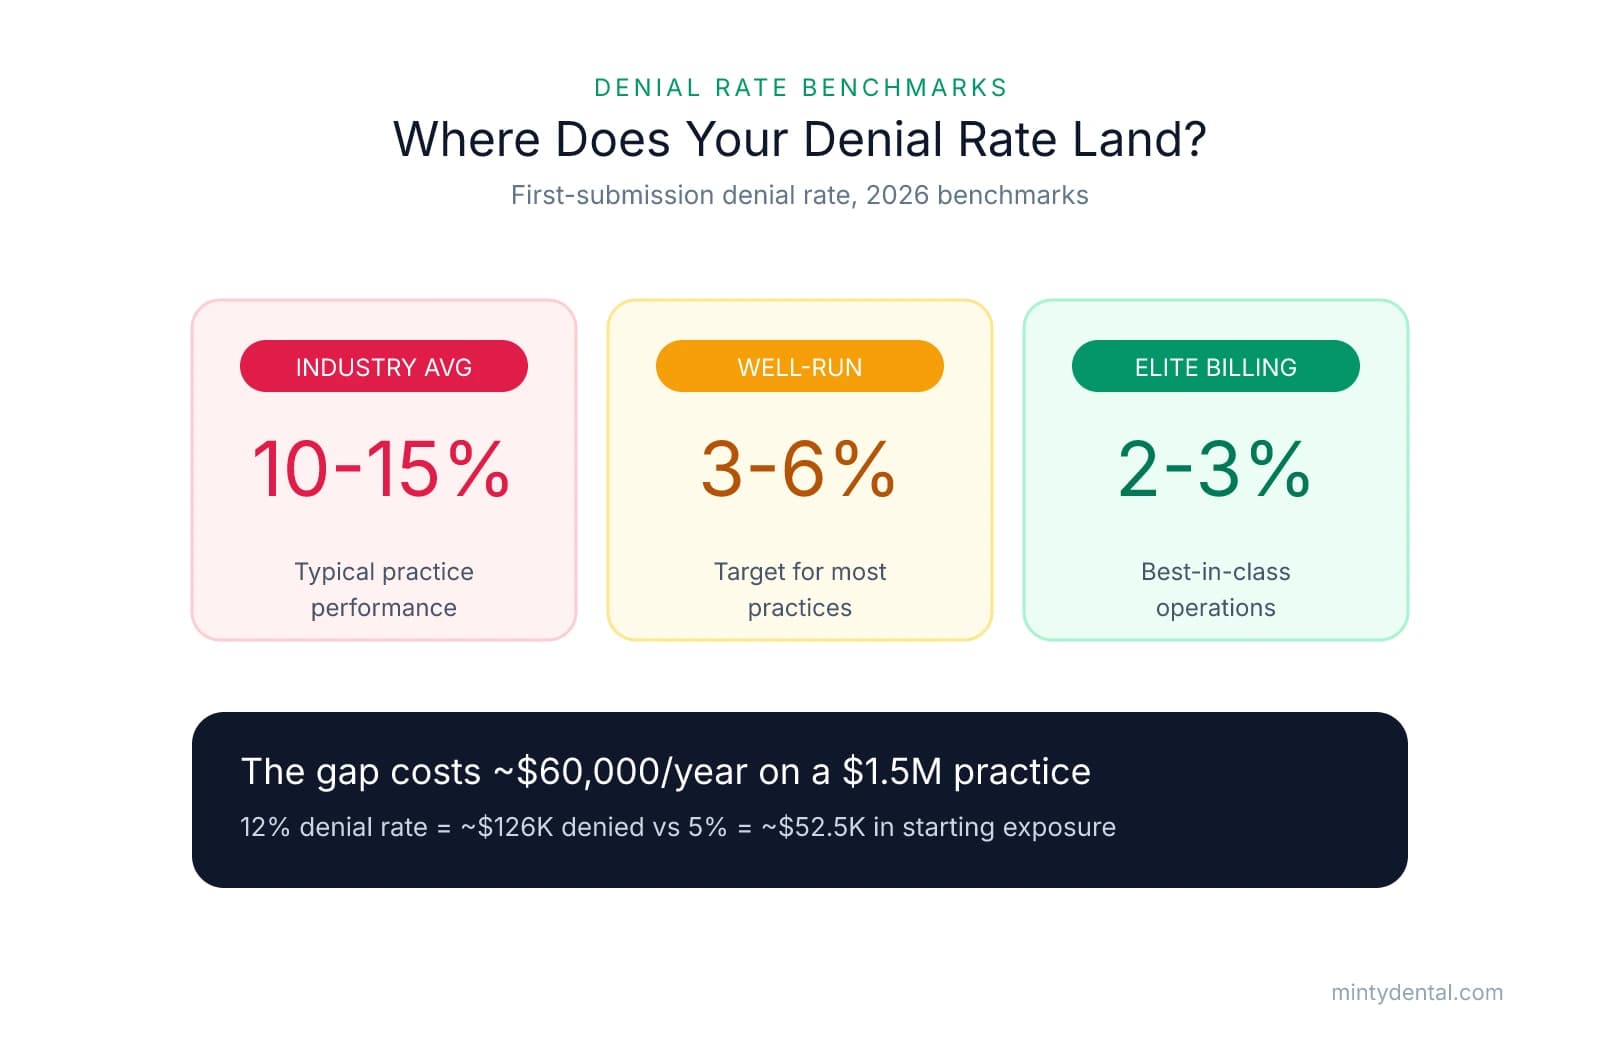
The benchmarks for 2026 put the industry average first-submission denial rate at 10–15%, with well-run practices landing in the 3–6% range and elite billing operations consistently at 2–3%. The gap between average and best-practice performance translates directly into dollars. To illustrate: a hypothetical practice with $1.5M in annual production, 70% of which runs through insurance, collects roughly $1.05M from payers. At a 12% denial rate, around $126,000 worth of claims are denied on first submission. At a 5% denial rate, that figure drops to $52,500. Even assuming some portion of denied claims eventually get recovered through appeals, the difference in starting exposure is roughly $60,000 per year in claims that need to be chased, appealed, or resubmitted. That's a hypothetical illustration, but the arithmetic holds regardless of practice size.
The reason that gap tends to grow silently is that up to 65% of denied claims are never resubmitted. When a denial sits in a queue and no one follows up, it doesn't show up as a loss on most dashboards. It just ages out of the AR report and eventually disappears. Untracked denials are effectively permanent write-offs on treatment you've already delivered.
How to Pull Your Denial Rate from Your Practice Management Software
The denial rate number you need is not on your production or collection dashboard. It lives in the insurance claims module of your practice management software, or in the reports your clearinghouse generates. Most owners never look there, which is why the problem stays invisible.
Here is where to find it in the three most common systems:
| System | Where to Navigate | What to Pull |
|---|---|---|
| Dentrix | Reports > Management > Insurance Aging Report | Filter by "Denied" status; sort by carrier and claim date |
| Eaglesoft | Insurance > Claims Manager > Outstanding Claims | Filter status column to "Denied"; export to sort by reason code |
| Open Dental | Reports > Monthly Insurance Aging or Claim Snapshot | Filter by "Received, no payment" and cross-reference with EOB denial codes |
None of these systems surfaces a denial rate percentage automatically. You are pulling a filtered claim list and doing a short calculation from it.
To calculate your rate, pull the count of denied claims from your filtered report over a rolling 90-day window, pull the total submissions from the same date range, and divide. Use 90 days rather than a single month because one month of data is too small a sample to distinguish a real pattern from a rough stretch with one carrier.
Track two versions of this number, not one.
Your overall denial rate counts every claim that came back refused, including claims that were corrected and resubmitted multiple times. Your first-pass denial rate counts only claims denied on their initial submission, before any rework. The first-pass rate is the more useful number because it tells you how clean your claims are going out the door, which is where you actually have leverage. A low overall rate can mask a messy first-pass rate if your team is good at catching and resubmitting denials quickly.
One important data-quality issue to watch: some staff correct rejected or denied claims and resubmit without logging the original refusal anywhere. If those corrections happen before the denial is recorded in the system, they disappear from your report and your rate looks artificially clean. Before you trust the number, confirm with your billing coordinator how corrections are being entered. The original denial needs to remain in the record even after the claim is fixed and resubmitted.
Once you have 90 days of denied claims pulled, sort by three columns: carrier, CDT procedure code, and denial reason code. That sorting step is what converts a raw percentage into a diagnosis. A denial rate of 8% is too vague to act on. "Eight percent overall, driven by Delta Dental denying D4341 for insufficient periodontal charting, 23 claims in 90 days" tells you exactly where to start. That kind of sorting is also what makes the financial case for doing this monthly. Reworking a single denied claim costs between $25 and $117 in direct staff time, and denial rate is one of those metrics that compounds quietly if you only check it when something already feels wrong, which is why it belongs alongside your other monthly KPIs rather than in a quarterly review.
The Three Root Causes of Dental Claim Denials — and the Fix for Each
Most practices respond to denials by appealing them. That's the wrong battle. A peer-reviewed analysis of a large dental insurer's claims data found that 72.88% of denials were administrative in origin, compared to just 25.95% clinical. The implication is significant: the majority of your denied claims were preventable before they were ever submitted, not recoverable after the fact.
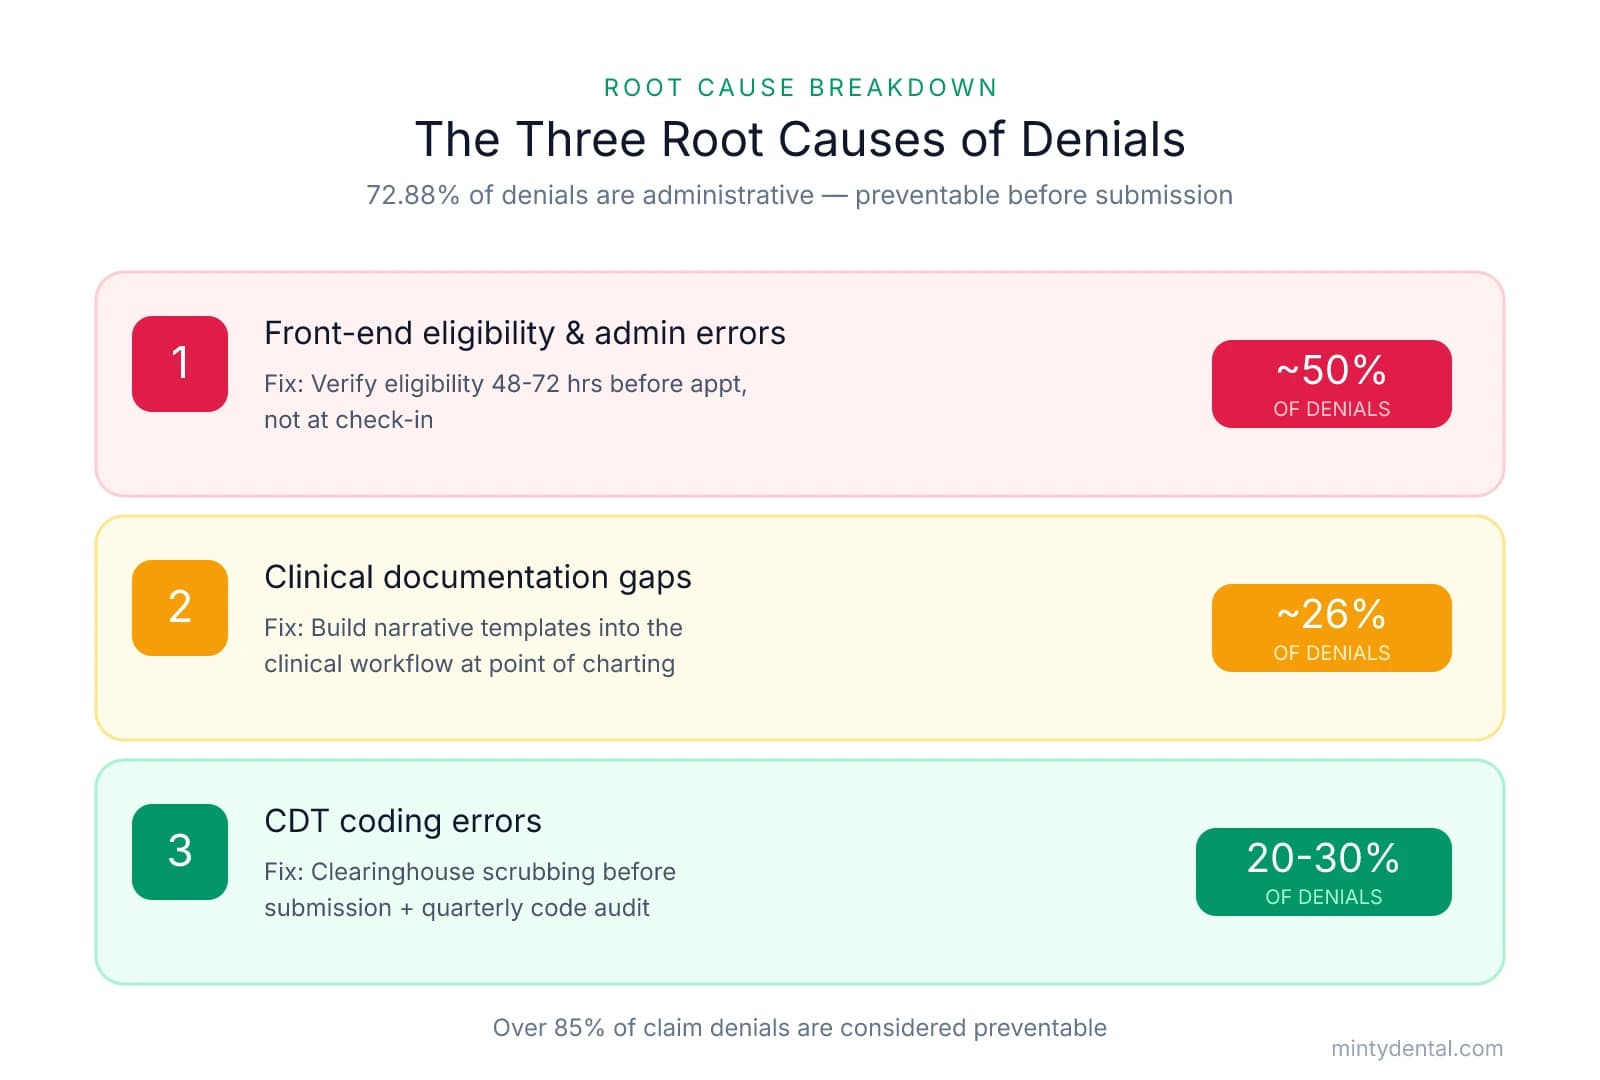
The three root causes break down roughly like this:
| Root Cause | Share of Denials | Primary Fix |
|---|---|---|
| Front-end eligibility and administrative errors | ~50% | Verify eligibility 48-72 hours before appointment, not at check-in |
| Clinical documentation gaps | ~26% | Build narrative templates into the clinical workflow at the point of charting |
| CDT coding errors | ~20-30% | Clearinghouse scrubbing before submission; quarterly code audit |
Root Cause 1: Front-end eligibility and administrative errors
This is the largest single driver. Inactive coverage, wrong member ID, coordination of benefits errors for dual-coverage patients, missing prior authorizations, and incorrect provider information all produce denials that had nothing to do with the treatment delivered. Roughly half of all denials originate at the front end, from eligibility and registration errors, which means the fix is entirely in your hands before the patient sits in the chair.
The key shift is when verification happens. Checking eligibility at check-in tells you the patient has a card in their wallet; it doesn't give you time to resolve a coverage lapse, clarify a COB order, or obtain a prior authorization before treatment. Verifying 48 to 72 hours before the appointment does. For dual-coverage patients, confirm which plan is primary and which is secondary at that same point, not during billing. For higher-cost procedures like implants or full-coverage crowns, check prior authorization requirements when you schedule, not after you've already sent the claim. Practices that implement structured pre-appointment verification see first-pass acceptance rates improve 25 to 35%.
Root Cause 2: Clinical documentation gaps
This is where SRP, core buildups, and crowns pile up in the denied claims queue. The treatment was appropriate; the chart note just didn't make the case for it.
The ADA's guidance on SRP claims is specific: supporting documentation should include diagnostic-quality bitewing or full-mouth series radiographs (not panoramic), a complete periodontal chart with at least six probing sites per tooth showing attachment loss, and a written narrative indicating periodontal disease. For crowns, the narrative needs to address tooth number, extent of decay or fracture, remaining sound structure, and why a more conservative option wasn't viable.
The fix isn't asking your billing coordinator to write better narratives after the fact. It's building the narrative template into the clinical workflow so that completing the chart note at the time of treatment generates the supporting documentation automatically. If the probing depths, attachment loss measurements, and clinical findings are recorded in the chart, the narrative writes itself. When it's a billing afterthought, it gets skipped or abbreviated, and the payer has no reason to pay.
Root Cause 3: CDT coding errors
This category includes billing an anterior composite code on a posterior tooth, unbundling procedures that payers expect to see combined, applying modifiers without supporting documentation, and submitting duplicate claims. These aren't necessarily errors your team is making repeatedly — often it's one or two CDT codes that account for most of the problem.
The first line of defense is running every claim through a clearinghouse scrubber before submission. Scrubbers catch code-surface mismatches, missing attachments, and duplicate submission flags before the payer ever sees the claim. The second step is a quarterly audit: pull your ten most-denied CDT codes, cross-reference them against the clinical notes, and look for the pattern. If D2950 keeps coming back denied, check whether the documentation is consistently supporting the buildup or whether the code is being applied in situations where a simpler restoration was charted.
Building a Monthly Denial Review That Prevents Recurrence
The shift that actually moves denial rates is simple to describe and consistently skipped: reviewing denial patterns before the month ends, not after the damage compounds. Most practices work denials reactively, meaning someone touches a claim when it comes back refused. The monthly review is a different activity. It's a 30-minute meeting with your office manager or billing coordinator where you look at patterns, not individual claims.
At the end of each month, pull a 90-day denial report sorted by carrier and CDT code to identify your top three denial reasons by volume. From there, assign each one a root cause—front-end eligibility, documentation gap, or coding error—and implement one targeted fix before the next month's review. One fix per month, applied consistently, compounds quickly.
The timely filing window is what makes this cadence non-negotiable rather than aspirational. Payers set resubmission and appeal deadlines that typically run 90 to 180 days from the date of service, and those windows vary by carrier. A claim that ages past its deadline is unrecoverable regardless of how strong the documentation is. A monthly review catches aging claims while the window is still open. A quarterly review often doesn't.
Because over 85% of claim denials are considered preventable, this is a prevention meeting rather than a recovery meeting. The denials you're reviewing are the source data for stopping next month's version of the same problem.
The connection to net collection rate is direct and often invisible. Consider a hypothetical practice with a 12% denial rate where 65% of those denied claims are never resubmitted: that practice is effectively writing off roughly 8% of its insurance-billed production. If the team thinks they're collecting well because the posted collection rate looks reasonable, they're missing the leak entirely, and a depressed net collection rate with no obvious cause is often denial-driven in exactly this way.
Three KPIs belong on a simple monthly dashboard for this:
| Metric | Target |
|---|---|
| Denial rate | Under 5% |
| First-pass acceptance rate | Above 95% |
| Claims aged 90+ days as % of total AR | Under 15% |
These three numbers together tell you whether claims are going out clean, coming back paid, and getting worked before the filing window closes. If your office manager isn't currently tracking these, building that habit is a meaningful shift in how the role functions. The difference between a billing coordinator who works denials and one who prevents them is largely whether these numbers get reviewed monthly, and whether someone is accountable for the pattern.
Sources & References
The data and claims in this article are drawn from the following sources. We prioritize government data, peer-reviewed research, and established industry publications to ensure accuracy.
- 78% of dental offices see uptick in claim denials: Report— beckersdental.com
- Insurance Denial Rate Benchmarks for Dental Practices in 2026— www.arini.ai
- Average Cost of Managing Denials in Healthcare Revenue Cycle— datarovers.comIndustry
- Administrative and clinical denials by a large dental insurance provider— pubmed.ncbi.nlm.nih.govGovernment
- Roughly half of all denials originate at the front end, from eligibility and registration errors— rivethealth.com
- [PDF] Responding to Claim Rejections - ADA - American Dental Association— ada.orgIndustry
- Top Reasons Dental Insurance Claims Get Denied, and How to ...— www.insidedesk.com
- over 85% of claim denials are considered preventable— rivethealth.com
Turn Claim Denials Into Recovered Collections
If your denial rate is higher than it should be, fixing the root cause is a billing workflow problem Minty Operations can help you solve. We handle the business side of your practice so denials get caught, corrected, and resubmitted before they cost you.