Dental Practice KPIs to Track Every Month

Co-Founder, Minty Dental

In Summary
- Dental practice KPIs are measurable values that reveal whether your practice is on track — not just how busy it is, but whether that activity is translating into growth and profitability.
- Production and collections are lagging indicators: they confirm what already happened. By the time they dip, the underlying cause has usually been building for weeks or months.
- Leading indicators like case acceptance rate, hygiene reappointment rate, and new patient count give you an early warning before revenue is affected.
- The ADA recommends starting with a limited set of KPIs tracked consistently, rather than pulling every available report — 8 to 10 metrics reviewed monthly is a reasonable starting point.
- Most practice management software already generates these reports; the gap is knowing which ones to pull and what to compare them against.
Tracking Production and Collections Alone Leaves Half the Picture Dark
A dental practice KPI is a measurable value that tells you whether the practice is on track financially and operationally. That's different from a raw activity count like appointments completed or procedures billed. A KPI connects an activity to a meaningful outcome, which is what makes it useful for decisions rather than just record-keeping.
Most owners pull production and collections every month, and those numbers matter. But they're lagging indicators, meaning they confirm what already happened. If monthly production is flat or sliding, the cause almost certainly started weeks earlier. By the time the number moves, you've already lost the revenue.
Leading indicators work differently. Metrics like case acceptance rate, hygiene reappointment rate, and new patient count shift before revenue does. They're the early-warning layer that gives you room to act.
Consider a hypothetical: a practice running roughly $85,000 in monthly production for the past quarter. The number looks stable, so nothing raises a flag. But case acceptance has been sliding from 78% to 61% over those same three months. The production figure is holding up because the schedule is full, but fewer treatment plans are being converted. In another month or two, that acceptance gap starts showing up in production. By then, the practice has already missed several weeks of recoverable revenue. The lagging number told the owner what happened; the leading number would have told them why and when.
Both types of indicators matter, and the relationship between them is what makes a monthly review useful. Without leading indicators, you're reading yesterday's news. Without lagging indicators, you have no way to confirm whether an improvement in a leading metric actually moved the bottom line.
Tracking a limited, consistent set of KPIs works better than generating every available report from your practice management software. Starting with 8 to 10 metrics and reassessing them at least quarterly tends to be more useful than a sprawling dashboard that nobody reviews closely. The software most practices already use generates these reports; the bottleneck is usually knowing which ones to pull and what a meaningful shift actually looks like.
The Financial KPIs: Production, Collections, Overhead, and AR
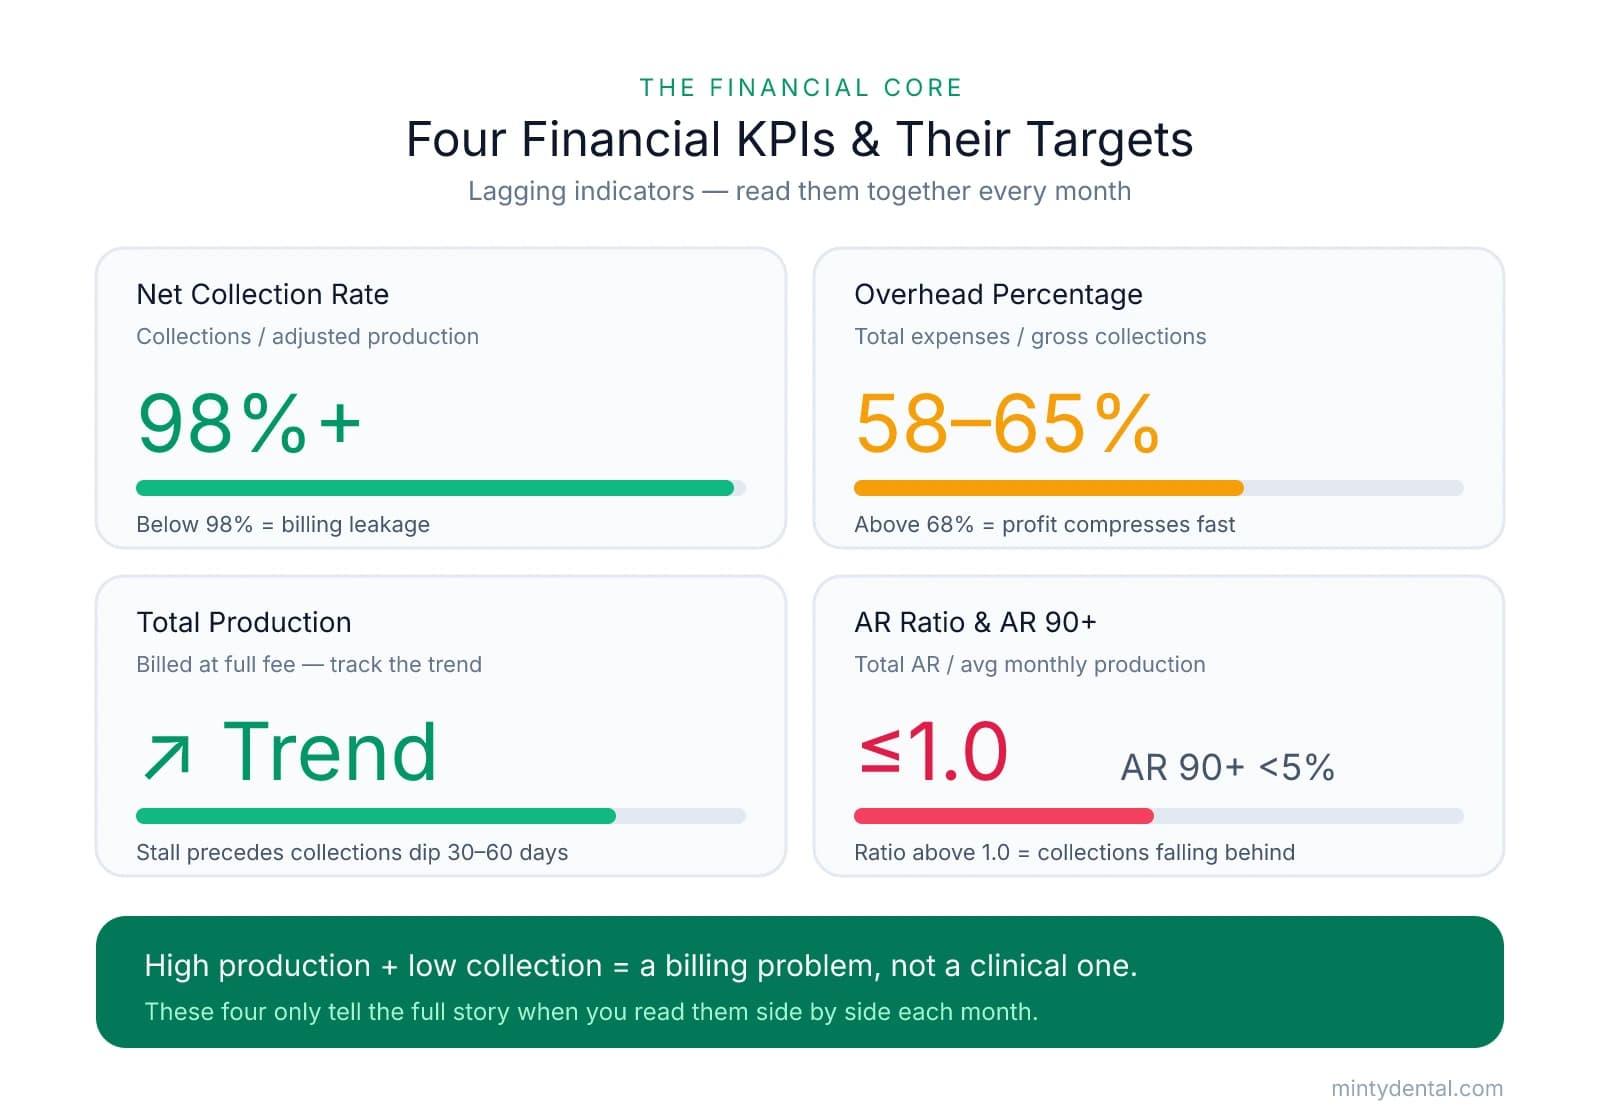
These four metrics form the core of any monthly financial review. They're all lagging indicators, but they tell different parts of the story, and reading them together is what makes them useful.
| Metric | Formula | Target | What a deviation signals |
|---|---|---|---|
| Net collection rate | Collections / adjusted production x 100 | 98%+ | Below 98%: billing leakage, insurance write-offs, or uncollected balances; above 100%: prior-period payments posting late |
| Overhead percentage | Total expenses / gross collections x 100 | 58-65% (solo GP) | Above 68%: profitability problem requiring diagnosis by category; below 58%: may signal underinvestment in staff or supplies |
| Total production | Track month-over-month and year-over-year | Positive trend | Stagnation or decline often precedes a collections dip by 30-60 days |
| AR ratio / AR over 90 | Total AR / avg monthly production; AR 90+ / total AR | 1.0 or less; under 5% | Ratio above 1.0: collections falling behind production; AR 90+ over 5%: bad debt risk rising |
Net Collection Rate
The number most practices already track, gross collections divided by gross production, is actually the wrong denominator. That calculation includes contractual write-offs, the discounts you agreed to when you signed insurance contracts. Those adjustments aren't collectible revenue, so using them to benchmark your collections flatters the result.
The correct formula uses adjusted (net) production: contractual write-offs removed, leaving only what you were actually entitled to collect. Divide collections by that figure and you get the net collection rate. The target is 98% or higher.
The gap between 95% and 98% sounds small. On a practice producing $1.2 million annually, it's roughly $36,000 left uncollected each year, without any additional overhead. If you're noticing a shortfall in your collection rate, the AR aging report usually tells you where the leakage is concentrated, whether that's insurance balances sitting unpaid or patient portions going to collections.
Overhead Percentage
Total expenses divided by gross collections gives you overhead as a percentage of revenue. For a solo general practice, the benchmark range is roughly 58-65%, with staff costs alone typically running 25-28% of collections. Once overhead climbs above 68%, profitability compresses fast, and the diagnosis requires looking at each expense category separately rather than the total. Supply costs, lab fees, and staffing each move for different reasons, and cutting indiscriminately tends to create new problems. If your overhead is running high, isolating which category is driving it is the necessary first step.
Total Production
Production is what you billed at full fee before any adjustments, not what you collected. Track it as a trend, month-over-month and year-over-year, rather than reacting to any single month. A flat production number that has been flat for three consecutive months is more meaningful than one soft month surrounded by normal ones. Production stagnation often precedes a collections dip by 30-60 days, because the billing cycle creates a lag between treatment delivered and payment received. That delay means a scheduling or case acceptance problem can be invisible in collections data for over a month.
AR Ratio and AR Over 90 Days
Your AR ratio is total outstanding accounts receivable divided by average monthly production. A ratio at or below 1.0 means your AR balance equals no more than one month of production, which is the standard target. A ratio of 1.5 means six weeks of revenue is sitting uncollected, tying up cash flow and increasing the risk that older balances become unrecoverable.
The AR aging report breaks that total down by how long each balance has been outstanding. AR over 90 days should stay below 5% of your total AR. Beyond that threshold, collection probability drops sharply. Most practices run 30-45 days DSO (days sales outstanding), with top performers consistently under 25 days.
Reading Production and Collections Together
These numbers only tell the full story when you compare them directly. High production with a low collection rate points to a billing or insurance problem, not a clinical one. Treatment is being completed, but payment isn't following. Low production with a normal collection rate is a different problem entirely: scheduling gaps, low case acceptance, or insufficient new patient volume. The clinical work that's getting done is being collected on, but there isn't enough of it. Both situations look fine in isolation until you put the two numbers side by side.
The Operational KPIs: Case Acceptance, New Patients, Hygiene Reappointment, and Production Per Hour
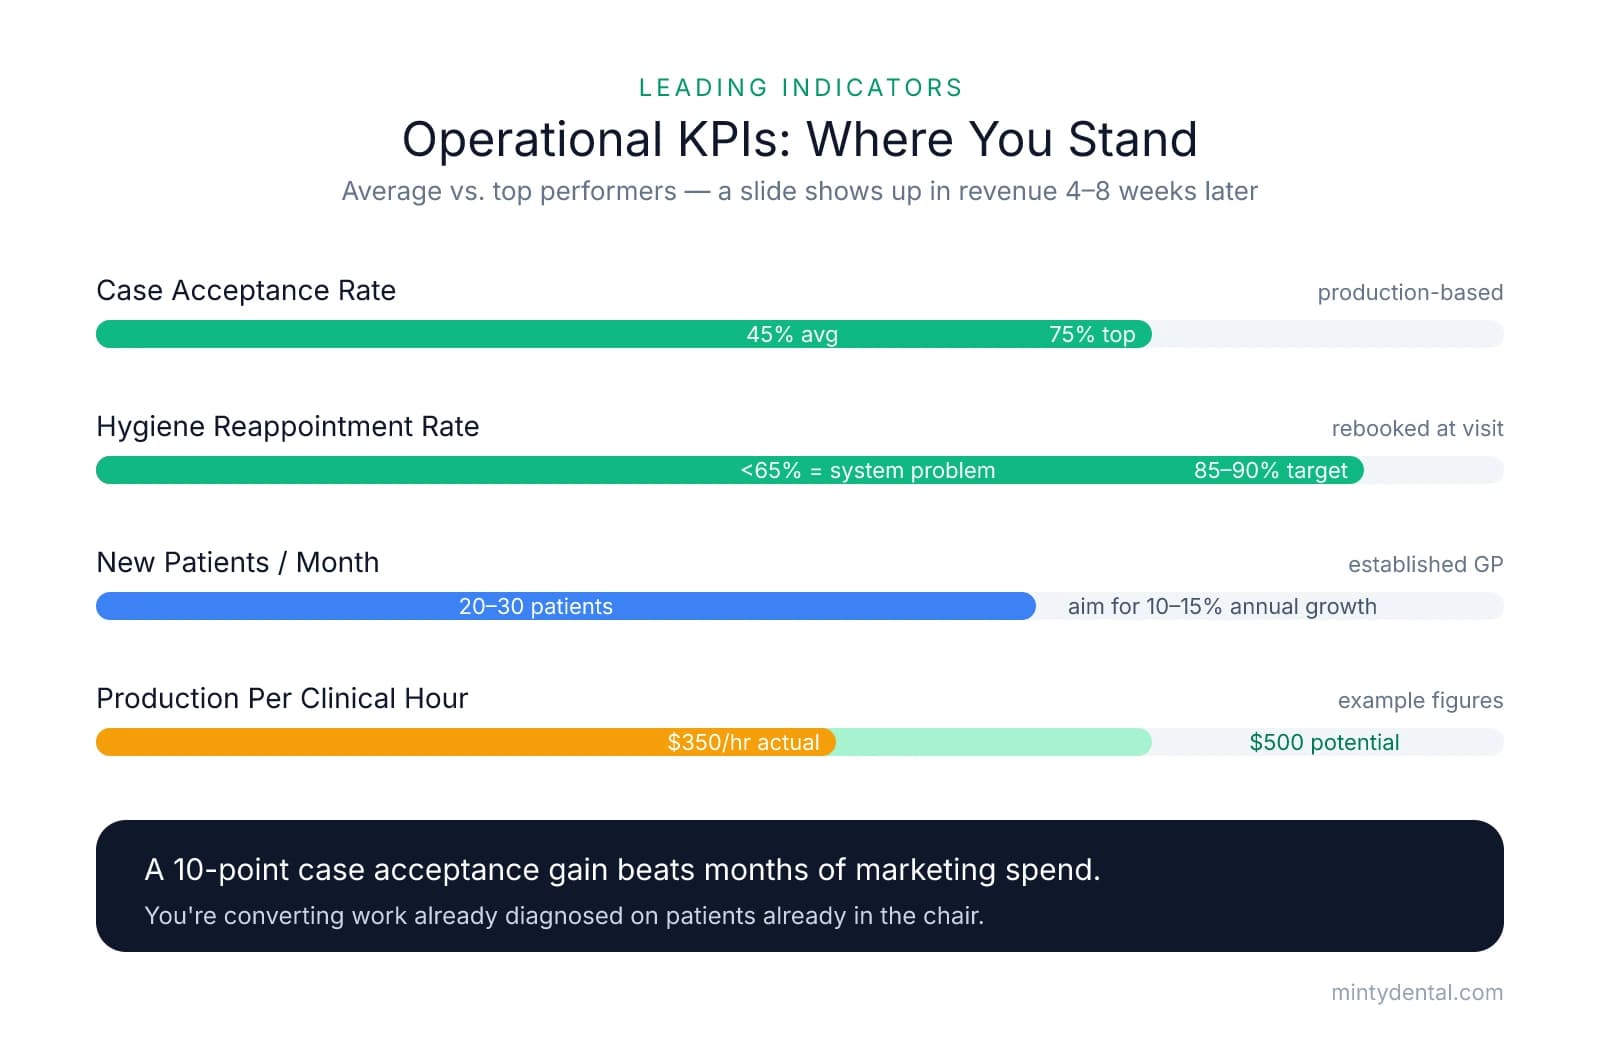
These four metrics are leading indicators. A slide in any one of them will show up in production and collections roughly 4 to 8 weeks later, which is exactly why they belong in your monthly review rather than a quarterly one.
Case Acceptance Rate
Formula: Accepted treatment value / presented treatment value x 100
There are two ways to calculate case acceptance: patient-based (how many patients said yes) and production-based (how much of the presented dollar value was accepted). For tracking high-value procedures, the production-based formula is more useful. A patient who accepts a cleaning but declines a $4,000 crown counts as a "yes" in a patient-based calculation, even though the financially significant decision went the other way.
The industry average for case acceptance sits at 45%, while top-performing practices reach 75%. A 10-point improvement in case acceptance typically moves the revenue needle more than months of new patient marketing spend, because you're converting work you've already diagnosed on patients already in the chair.
If your rate is sitting near the average or below it, the causes are usually identifiable: incomplete financial clarity at the time of presentation, inconsistent follow-up on declined treatment, or a consent conversation that assumes the patient understands urgency when they don't.
New Patient Count
Formula: Count of patients completing their first visit in the month
Healthy established general practices typically see 20 to 30 new patients per month, though that range varies by capacity, market, and practice age. The more useful frame is growth trend: practices targeting sustainable growth generally aim for 10 to 15% annual new patient increases.
The right target for your practice isn't a generic number. It's derived from your attrition rate. If you're losing 15% of your active patient base annually, you need enough new patients to offset that before you can grow. A practice with strong retention needs fewer new patients to maintain production than one with high turnover. Pull your attrition data alongside new patient count and the picture gets clearer.
Hygiene Reappointment Rate
Formula: Patients rebooked before leaving / total hygiene visits x 100
Target 85 to 90% rebooked at the visit. If you're below 65%, you likely have a recall system problem, not just a patient compliance problem. Hygiene reappointment is one of six core practice KPIs specifically because of what it predicts: hygiene is where most restorative treatment gets diagnosed, so a weak reappointment rate quietly suppresses future restorative production. A patient who leaves without a next appointment is far less likely to return at all. Improving this number doesn't always require a new recall system; it often comes down to what the hygienist or front desk says at checkout.
Production Per Clinical Hour
Formula: Total production / total clinical hours worked
This metric normalizes for the number of days the practice was open, which makes month-to-month comparisons meaningful even when February has fewer working days than March. It also reveals whether a production problem is a capacity issue or a schedule design issue. A practice running $350 per clinical hour when the math supports $500 isn't necessarily underbooked; it may be blocking time inefficiently or filling the schedule with low-value appointments that crowd out higher-production procedures. You can also use this metric to compare provider performance fairly, since it accounts for differences in hours worked.
Running a Monthly KPI Review That Actually Changes What You Do
The value of these eight metrics depends entirely on whether you review them consistently and follow through on what they tell you. A report that gets pulled whenever things feel off is just a lagging indicator of your own concern. A fixed monthly cadence turns the data into a management tool.
Pick one day and stick to it. The 5th business day of the month works well for most practices because payroll has cleared and most of the prior month's claims have posted. Pull all eight KPIs on that day, every month, without exception. The consistency matters more than the specific date.
Once you have the numbers, compare each metric against its benchmark AND against your prior three months. A single outlier month is usually noise: a slow January, a week of weather cancellations, a billing staff vacation. A three-month directional move is a signal worth acting on. Case acceptance sliding from 74% to 68% to 61% over a quarter is not a rough patch. It's a trend that will show up in production within 4 to 6 weeks if nothing changes.
When a metric is off, resist the instinct to jump straight to a fix. Trace it to a root cause first, because the same KPI can go wrong for different reasons. Low case acceptance could be a presentation problem, a patient financing barrier, or a scheduling issue where treatment plans are being discussed in a rushed handoff. It's good practice to reassess which KPIs you're tracking at least quarterly as the practice grows, because the metrics that matter most at your current stage may shift. The same logic applies to your corrective actions: the right response depends on the right diagnosis.
Here's how that plays out in practice. Hygiene reappointment rate drops from 82% to 71% over two months. Before assuming patients aren't complying, check whether the front desk is offering the next appointment at checkout or sending a recall card later. Those are very different workflows with very different conversion rates. The fix in the first case is a checkout script audit; in the second, it's a process change. Assign the office manager to review the checkout script by end of the week. That's one owner, one deadline, one specific task. Unowned action items don't get done.
The entire review should take 30 to 45 minutes, not a half-day. You're not performing an audit; you're identifying the one or two metrics furthest from target and deciding what to do about them. The morning huddle handles daily course corrections; this monthly session handles the slower-moving trends the daily view can't catch. Think of the role your office manager plays here carefully: reviewing these numbers together and assigning follow-through is part of managing versus just staying busy.
Sources & References
The data and claims in this article are drawn from the following sources. We prioritize government data, peer-reviewed research, and established industry publications to ensure accuracy.
- Improve Your Dental Practice With Leading and Lagging KPIs— www.claconnect.com
- 4a. Key Performance Indicators (KPIs) | American Dental Association— ada.orgIndustry
- Dental Practice Profit Margin: 2026 Benchmarks, Cost Structures, and ...— www.patientprism.com
- Days Sales Outstanding Benchmarks for Dental Practices in 2026— www.arini.ai
- Dental Case Acceptance Rate for DSOs - Henry Schein One— www.henryscheinone.com
- Measure dental practice success with these six KPIs - CDA— cda.orgIndustry
Turn Your Monthly KPIs Into Cleaner Operations
Tracking the right numbers is only half the work. Minty helps independent practice owners act on what those numbers reveal, from billing and collections to scheduling and overhead.