Dental Practice Collection Rate Too Low: How to Find the Leaks

Co-Founder, Minty Dental

In Summary
- Most dental practices track gross collection rate, which includes PPO contractual write-offs that were never real revenue — this makes the number nearly meaningless for diagnosing billing problems.
- Net collection rate is the right metric: Total Payments Received divided by (Total Production minus Contractual Adjustments), multiplied by 100.
- High-performing practices run above 96% net collection rate; the industry average sits between 91% and 95%; anything below 95% points to systemic revenue leakage.
- A 6-point gap on $2 million in net production means $120,000 in earned revenue that never arrives; a 2% improvement in a $1 million practice adds $20,000 to the bottom line.
- Many practices that believe they collect "around 95%" are measuring gross — their actual net rate is often closer to 88–92%.
Most Practices Are Measuring the Wrong Collection Rate
If you pulled your collection rate from your practice management software today, there's a reasonable chance you're looking at a number that includes revenue you were contractually prohibited from collecting. That's gross collection rate: total payments received divided by total production at your full fee schedule. In a PPO-heavy practice, your full fee schedule is largely theoretical. Insurance contracts have already obligated you to write off a significant portion of every claim before a single patient sits in the chair.
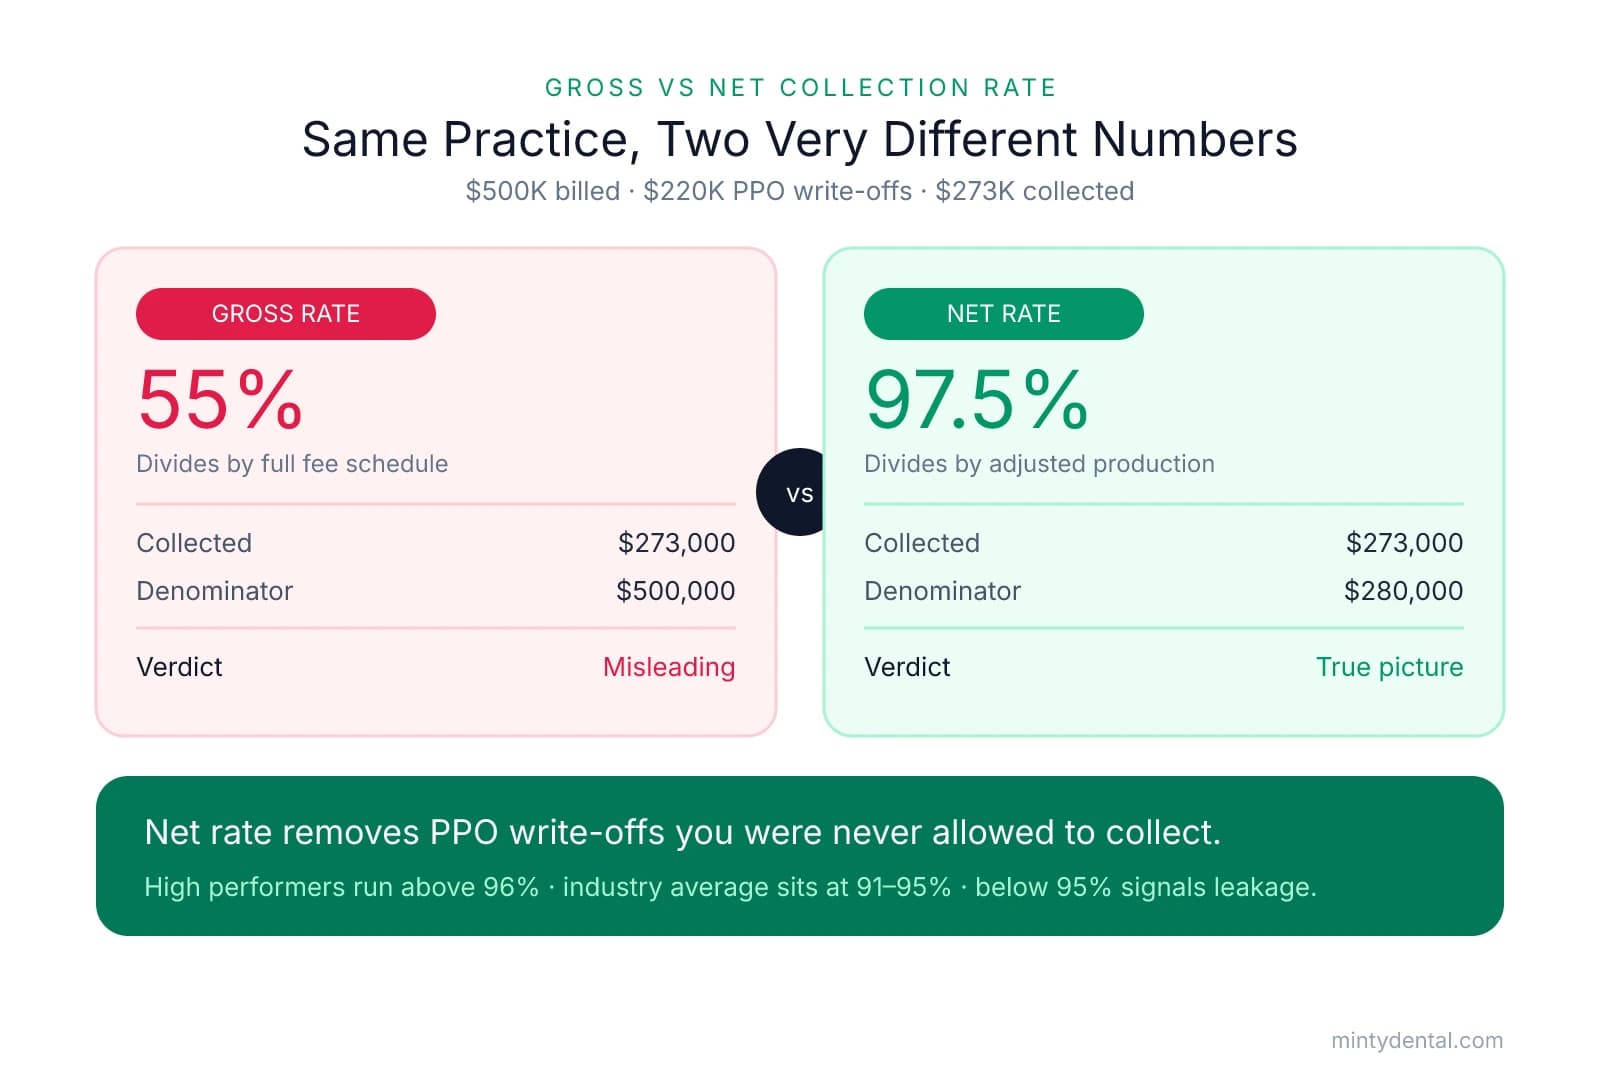
Gross collection rate divides what you collected by a denominator that includes those contractual write-offs. If your practice bills $500,000, carries $220,000 in PPO adjustments, and collects $273,000, your gross rate comes out to 55%. That looks like a struggling office. It isn't — it's just a misleading calculation.
Net collection rate removes the write-offs from the denominator, so you're measuring only against revenue you were actually entitled to receive:
Net Collection Rate = (Total Payments Received / (Total Production - Contractual Adjustments)) x 100
Run the same numbers: $273,000 divided by ($500,000 minus $220,000) equals $273,000 divided by $280,000, which is 97.5%. Same practice, same collected dollars, two very different conclusions. The net figure tells you whether your billing team is actually capturing what the contracts allow. The gross figure tells you almost nothing useful.
The practical benchmark: a net collection rate above 96% is where high-performing practices sit; the industry average runs 91% to 95%. Drop below 95% and you're looking at a systemic problem somewhere in the revenue cycle, not just random noise. The ADA's standard is 100% net-to-net, meaning every dollar of adjusted production gets collected.
The dollar stakes make this worth taking seriously. A 6-point gap between your actual net rate and a 96% benchmark, on $2 million in net production, represents $120,000 in earned revenue that never reached your bank account. On a smaller scale, closing a 2% collection rate gap in a $1 million practice adds $20,000 to the bottom line — which is not a rounding error.
The subtler problem is that many practice owners genuinely believe they're performing near benchmark because their software reports a number that looks like 94% or 95%. If that figure is gross collection rate, the underlying net rate is often 88% to 92%. Overhead decisions, staffing decisions, even the question of whether the practice is financially healthy enough to grow get made against a number that overstates actual billing performance. If you're thinking through the full cost structure of the practice, that kind of measurement error compounds — a point worth keeping in mind alongside the usual suspects in dental practice overhead.
Once you know your real net collection rate, the useful question shifts: where specifically is the gap? The number itself doesn't tell you whether the problem lives in billing errors, patient balances, insurance follow-up, or adjustments being applied incorrectly.
The Insurance Side: Denials, Aging AR, and Fee Schedule Drift
Most net collection rate problems have an insurance component. Whether it's claims coming back denied, old balances sitting untouched in the aging report, or payments arriving slightly short on every single claim, the insurance side of the revenue cycle tends to be where the largest dollar amounts quietly disappear. There are three distinct failure modes here, and they each require a different fix.
Unworked Denials
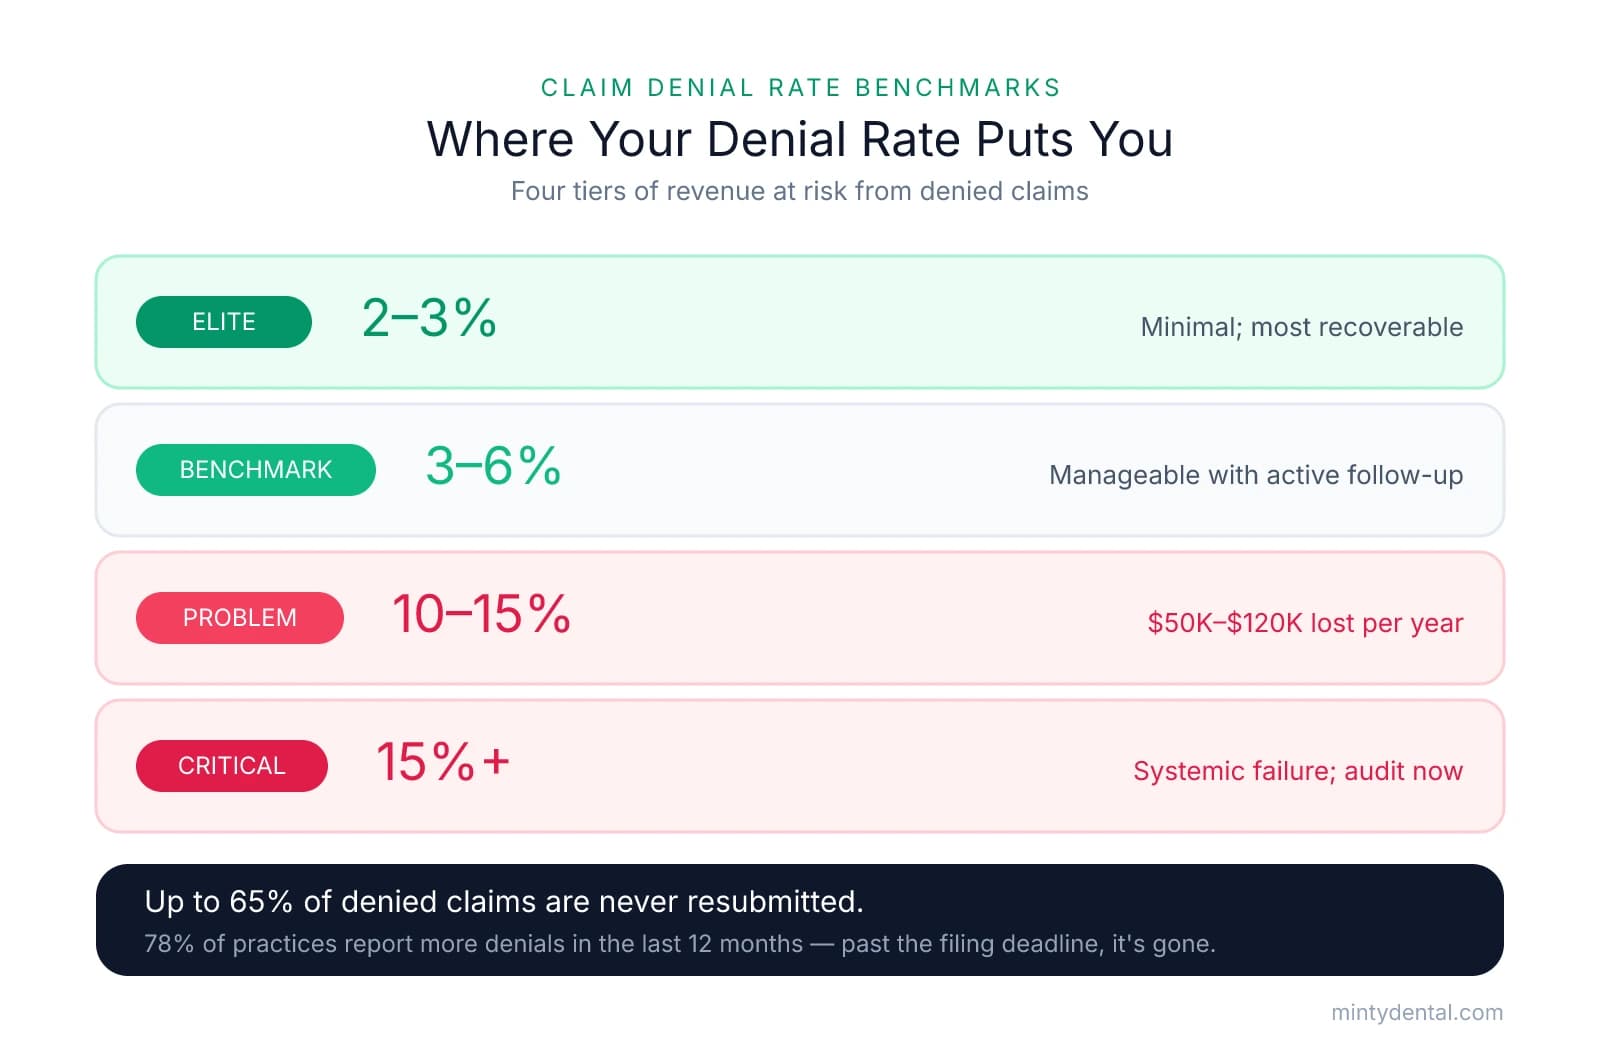
The industry average denial rate for dental practices runs 10 to 15%; high-performing billing operations hold that figure to 3 to 6%. The gap isn't just a performance footnote. Any practice running above 10% is estimated to lose $50,000 to $120,000 per year in revenue on care that was already delivered and documented.
The trend is moving in the wrong direction. 78% of dental practices report increased claim denials or heightened payer scrutiny over the past 12 months, driven by tighter documentation requirements, expanded prior authorization mandates, and closer CDT code scrutiny from major carriers. More denials hitting the inbox means more demands on whoever is responsible for following up.
The compounding problem is that most denials don't get worked. Up to 65% of denied claims are never resubmitted, and that's where recoverable revenue becomes permanent loss. Every denied claim has a timely filing deadline. Once that window closes, the payer has no obligation to process the claim regardless of how valid it was. A denial sitting in the queue isn't just delayed revenue; past the deadline, it's gone.
The mechanical fix is a weekly denial work queue with a firm 30-day follow-up trigger. Someone specific owns the queue. Denials don't age into write-offs by default.
| Denial Rate Tier | Rate Range | Estimated Annual Revenue at Risk |
|---|---|---|
| Elite | 2 to 3% | Minimal; most recoverable |
| Benchmark | 3 to 6% | Manageable with active follow-up |
| Problem | 10 to 15% | $50,000 to $120,000 in permanent write-offs |
| Critical | Above 15% | Systemic billing failure; requires immediate audit |
Aging AR
The AR aging report is where the second failure mode shows up most clearly. The working benchmark is that insurance AR over 90 days should stay below 10% of total AR. Once a balance crosses that threshold, the probability of ever collecting it drops below 50%, because insurers routinely deny stale claims and patient balances in that range tend to stop responding entirely.
Average days in AR for a healthy practice runs 28 to 35 days. Practices that drift above 45 days typically see the cash flow effects before they see the AR report clearly: slower vendor payments, payroll timing stress, less room for discretionary decisions. The AR aging report is a diagnostic tool, not just a compliance document, and it needs to function as a weekly work list, not a monthly glance.
Practically, this means one person owns the 60-day-plus column every Monday. Every balance in that column gets a specific next action, not a note that someone called and left a voicemail.
Fee Schedule Drift
The third failure mode is the quietest one. Many practices load their PPO fee schedules into their practice management software at credentialing and never touch them again. Carriers update contracted rates periodically, sometimes upward, sometimes with structural changes to specific codes. If the fee table in your software doesn't reflect the current contracted rate, the system may calculate and post an expected payment that's lower than what the contract actually allows, and when the EOB arrives at that lower figure, it posts as paid in full.
Underpayments that post as paid don't generate a denial. They don't trigger a follow-up queue. They just quietly reduce your net collection rate over time. The starting point for finding this is auditing your top 20 CDT codes by production volume against the actual contracted rates in your current provider agreement. If those rates haven't been reviewed in more than a year, it's worth doing alongside any PPO fee renegotiation conversation, since underpayment and undercontracted fees are related but distinct problems.
The Patient Side: Balances That Leave the Building Uncollected
Patient balances now represent 25 to 40% of total production in many general practices, a share that has grown steadily for over a decade as employers shifted toward high-deductible dental plans with lower annual maximums. That shift means the patient portion of your revenue cycle deserves as much systematic attention as the insurance side. Most practices give it far less.
The root cause of patient-side collection failure isn't patient refusal. It's surprise. Patients who learn their financial responsibility at checkout, after treatment is complete, experience it as an unexpected bill rather than a known obligation. That framing affects how quickly they pay, whether they dispute the amount, and whether they return. Patients who understood their responsibility before they sat in the chair treat the payment as a normal part of the visit.
Collect the Estimated Patient Portion at the Chair, Not After the EOB
Collect the patient's estimated portion at the time of service rather than waiting for the explanation of benefits to arrive, as the ADA recommends. Waiting turns a manageable checkout transaction into a billing cycle. The patient has left the building, the clinical experience has faded, and the statement arrives weeks later with no context. Payment rates on billed-after-service balances are consistently lower than point-of-service collections, and the follow-up cost to recover them is higher.
If the estimate turns out to be slightly off once the EOB arrives, send a statement immediately for the remaining balance. That gap is usually small and straightforward for the patient to understand. The ADA also recommends getting pre-authorization to charge any remaining balance to a card on file, which eliminates the follow-up cycle entirely for minor post-insurance adjustments.
Benefit Verification Gaps
Delivering treatment against inactive, exhausted, or misunderstood coverage creates patient balances that were never realistically collectible. The patient believed insurance would cover it. The practice assumed coverage was active. Neither verified. The resulting balance sits in AR aging while someone figures out how to have a difficult conversation, and often ends up written off.
Verification should happen before the appointment, not after. Checking eligibility and remaining benefits the day before gives the front desk time to have a financial conversation before the patient is already numb and in the chair. Financial friction handled that way stays manageable; the same conversation after the fact can damage the case acceptance dynamic and the patient relationship simultaneously.
The Written Financial Policy
A written financial policy that patients sign before treatment is the structural foundation for consistent patient-side collection. It should cover when payment is due, accepted payment methods, and specifically what happens with any balance that remains after insurance pays. The ADA provides a sample financial policy template practices can adapt. Without a signed policy, every collection conversation has to be built from scratch, and patients have a reasonable basis for claiming they didn't understand the expectation.
The 30/60/90-Day Follow-Up Workflow
Patient balances billed once and left alone are the most common source of patient-side write-offs. A structured follow-up sequence with defined escalation steps at 30, 60, and 90 days converts most of these into collected revenue. At 30 days, a statement or automated reminder. At 60 days, a direct outreach by phone. At 90 days, a defined decision point: payment plan, third-party financing, or escalation. Balances that age past 90 days without a next action are on a path to write-off by default.
Running a Collection Rate Audit and Tracking Progress
Start with four reports, pulling them in this order.
Adjusted production vs. collections for the trailing 12 months. This calculation gives you your true net collection rate: most practice management systems can generate an adjusted production report that strips out contractual write-offs, and you divide total payments received by that adjusted figure. Twelve months smooths out seasonal variation and gives you a number that holds up. Anything below 96% points to a specific failure somewhere downstream.
Insurance aging report sorted by payer and age bucket. Sort it by carrier first, then by age. Flag every balance over 60 days for immediate follow-up, and calculate what percentage of your total AR is sitting in the 90-day-plus bucket. The ADA recommends evaluating your collection systems when a practice is not collecting approximately 90% of fees due within 30 days and the remaining 10% within 60 days — so if your 90-day-plus bucket is growing, the warning sign is already there before you even look at the dollar amounts.
Denial report by payer for the last 90 days. Pull this by carrier, not in aggregate. Identify the top three denial reason codes. If one carrier is driving the majority of denials, that's a credentialing, documentation, or fee schedule issue specific to that relationship. Aggregate denial rates mask payer-level deterioration until it has compounded into a material AR problem.
Patient AR over 60 days with no payment activity. This is the list of balances that got billed and forgotten. These accounts aren't necessarily uncollectable, but they're on that path without structured follow-up.
Once you've run this audit once, make it a monthly cadence rather than a one-time exercise. Review net collection rate by payer, not in aggregate. A single underperforming carrier with a climbing denial rate or a pattern of slow payment won't show up in a blended number until it has already pulled your overall rate down meaningfully. Payer-level review catches that drift early, when it's still a billing workflow problem rather than a compounded AR crisis. For additional context on what healthy aging AR looks like across different practice types, the AR aging benchmarks for dental practices are worth keeping as a reference alongside your monthly pull.
The valuation connection is worth making explicit for anyone thinking about a future sale. Revenue cycle gaps are largely invisible in standard reporting but show up directly in EBITDA, because uncollected earned revenue never reaches the income statement. At a 5x EBITDA multiple, a $100,000 improvement in collected revenue translates to $500,000 or more in enterprise value. Fixing a low collection rate is the kind of operational improvement that increases practice value before a sale more reliably than adding equipment or expanding services, because it recovers revenue the practice has already earned.
Sources & References
The data and claims in this article are drawn from the following sources. We prioritize government data, peer-reviewed research, and established industry publications to ensure accuracy.
- How to Calculate the Net Collection Rate for a Dental Practice - CEC— www.cecomputech.comIndustry
- From production to collections: An overview of the operational cash ...— www.dentaleconomics.comIndustry
- Insurance Denial Rate Benchmarks for Dental Practices in 2026 - Arini— www.arini.aiIndustry
- Dental Accounts Receivable Aging: The 90-Day Problem— reciprocityaccounting.comIndustry
- Dental Patient Collections Guide— dentalbillingassist.comIndustry
- Overdue Accounts | American Dental Association— ada.orgIndustry
- How to Reduce Aging A/R in Dental Practices 2026 - AnnexMed— annexmed.comIndustry
- The 7 revenue cycle gaps most dental practices don't know they have— www.dentistryiq.comNews
Stop Leaving Revenue on the Table
A strong collection rate starts with the right operational systems behind your practice. Minty handles the billing and business infrastructure that keeps your revenue flowing.