Dental Practice Supply Costs Too High? How to Benchmark and Fix It

Co-Founder, Minty Dental

In Summary
- Supply cost percentage is clinical supply spend divided by net production (or collections) for the same period, expressed as a percent. The widely accepted normal range is 5% to 7% of net production, with the ADA suggesting a ceiling near 6% of the prior month's collections.
- A 1.4-point gap above the 6% benchmark costs roughly $28,000 per year on a $2M practice and $14,000 on a $1M practice, and that gap compounds as collections grow.
- Dental equipment and supply prices rose 6% in the year ending February 2026, triple the 2% general inflation rate, so practices that have not actively managed this line are likely running higher than they were two years ago.
- Supply costs are a variable overhead line that can be reduced this quarter, unlike rent or payroll.
- The most common reason a supply percentage looks high is a bookkeeping miscategorization, not overspending at the chair.
A Supply Cost Above 7% of Collections Deserves a Closer Look — But the Cause Is Rarely What Owners Expect
Supply cost percentage is clinical supply spend divided by net production (or collections) for the same period, expressed as a percent. It functions as a standalone benchmark within total overhead because it isolates one controllable line from rent, labor, and lab fees, which lets owners see whether chairside spending is in range.
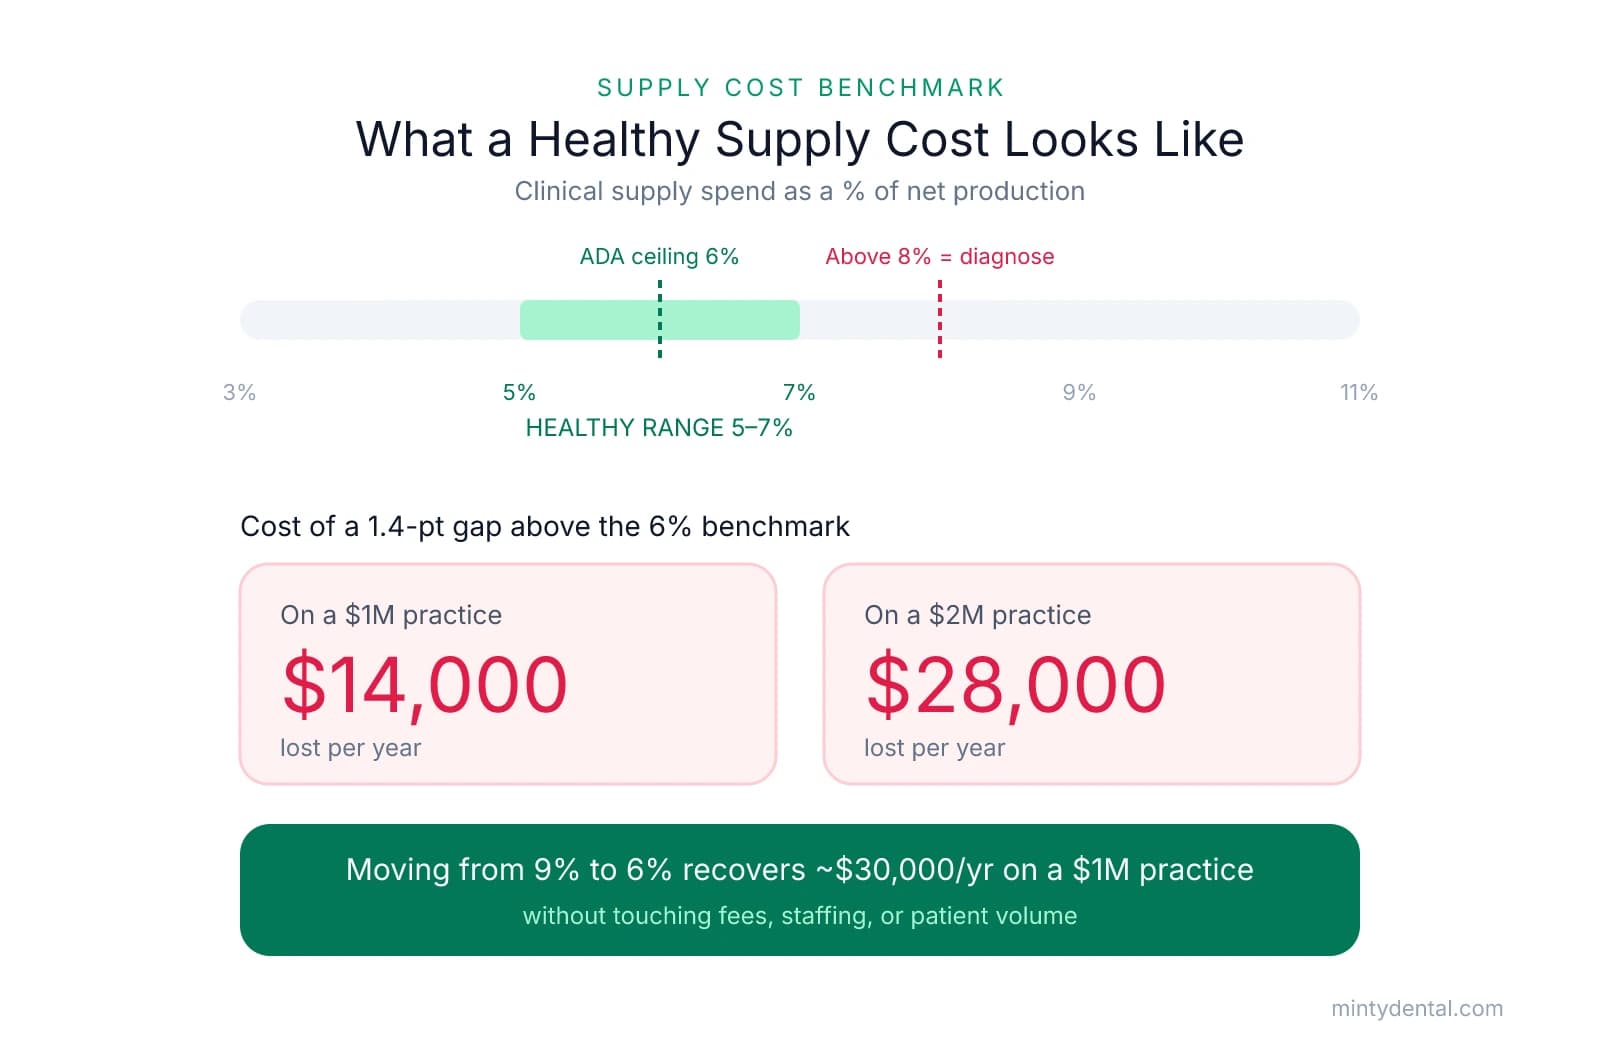
The normal range for a general practice is 5% to 7% of net production, and the ADA suggests budgeting up to about 6% of the prior month's collections as a working ceiling. Where a practice lands within that range has become harder to control recently, because dental equipment and supply prices rose 6% in the 12 months ending February 2026, triple the 2% general inflation rate. Practices that have not actively managed this line are likely running higher than they were two years ago.
The dollar value behind a small percentage is what makes it worth attention. A 1.4-point gap above the 6% benchmark on a $2M practice equals about $28,000 per year, and the same gap on a $1M practice equals roughly $14,000. That gap also scales with growth, so expanding collections without closing it means the difference grows alongside the practice.
Supply costs are one of the few overhead categories that can move this quarter. Rent is fixed by a lease, and staffing changes require restructuring compensation, both of which take time to adjust. Owners weighing where to cut overhead first often find supplies a practical starting point for this reason.
The insight that drives the rest of this guide is that most inflated supply figures are not caused by overspending at the chair. In many cases, lab fees, office supplies, or equipment purchases have been coded into the supplies line, which inflates the percentage artificially. Before cutting any spend, it helps to confirm the number is measuring what it claims to measure.
How to Calculate Your Supply Cost Percentage — and What to Include
Divide your clinical supply spend by your net production for the same period, then multiply by 100. For example, a practice with $65,000 in clinical supplies against $1,000,000 in net production over 12 months runs a 6.5% supply cost, inside the healthy range.
The denominator deserves attention. Dental overhead benchmarks are built on net production, the value of dentistry delivered after contractual insurance write-offs, rather than on collections, because collections swing month to month with payment timing. Net production is the technically correct base, and gross production overstates the denominator because it includes write-offs that were never collectible. Collections is an acceptable practical substitute, since most practice management software pulls it directly, and the two numbers track closely over a full year.
Pull a 12-month trailing period rather than a single month. Monthly supply figures swing with order timing and occasional bulk purchases, so one month can read 3% or 11% without any change in actual spending. A rolling year smooths those swings into a number you can trust.
The accuracy of the result depends on what you let into the supplies category. This is where most practices get the number wrong.
| Belongs in clinical supplies | Does not belong |
|---|---|
| Gloves, masks, and disposables | Lab fees (crowns, bridges, dentures, aligners) |
| Composite, bonding, and anesthetic | Office and administrative supplies (paper, toner, breakroom) |
| Burs, impression and scanning materials | Capital equipment (chairs, scanners, CBCT units) |
| Sterilization pouches, routinely replaced small instruments |
Three miscategorizations account for most inflated numbers:
- Lab fees mixed into supplies. This is the most expensive error. Lab work is a separate overhead category with its own 7% to 10% benchmark, and folding it into supplies can push an otherwise healthy percentage 3 to 5 points above range while the lab line disappears from view. Owners reviewing a high number often find the fix in separating and evaluating lab fees on their own line.
- Office and administrative supplies lumped in. Paper, toner, and breakroom items are facility costs, not chairside materials.
- Capital equipment expensed through supplies. Chairs, scanners, and CBCT units should be depreciated over their useful life, not run through the supplies line in the month of purchase, where they create a one-time spike.
Once the category is clean, compare the result against the 5% to 7% benchmark. A number inside that range with a sensible procedure mix explanation is not a problem. A figure above 8% warrants the diagnostic in the next section.
Four Reasons Supply Costs Run High — and How to Diagnose Which One Applies
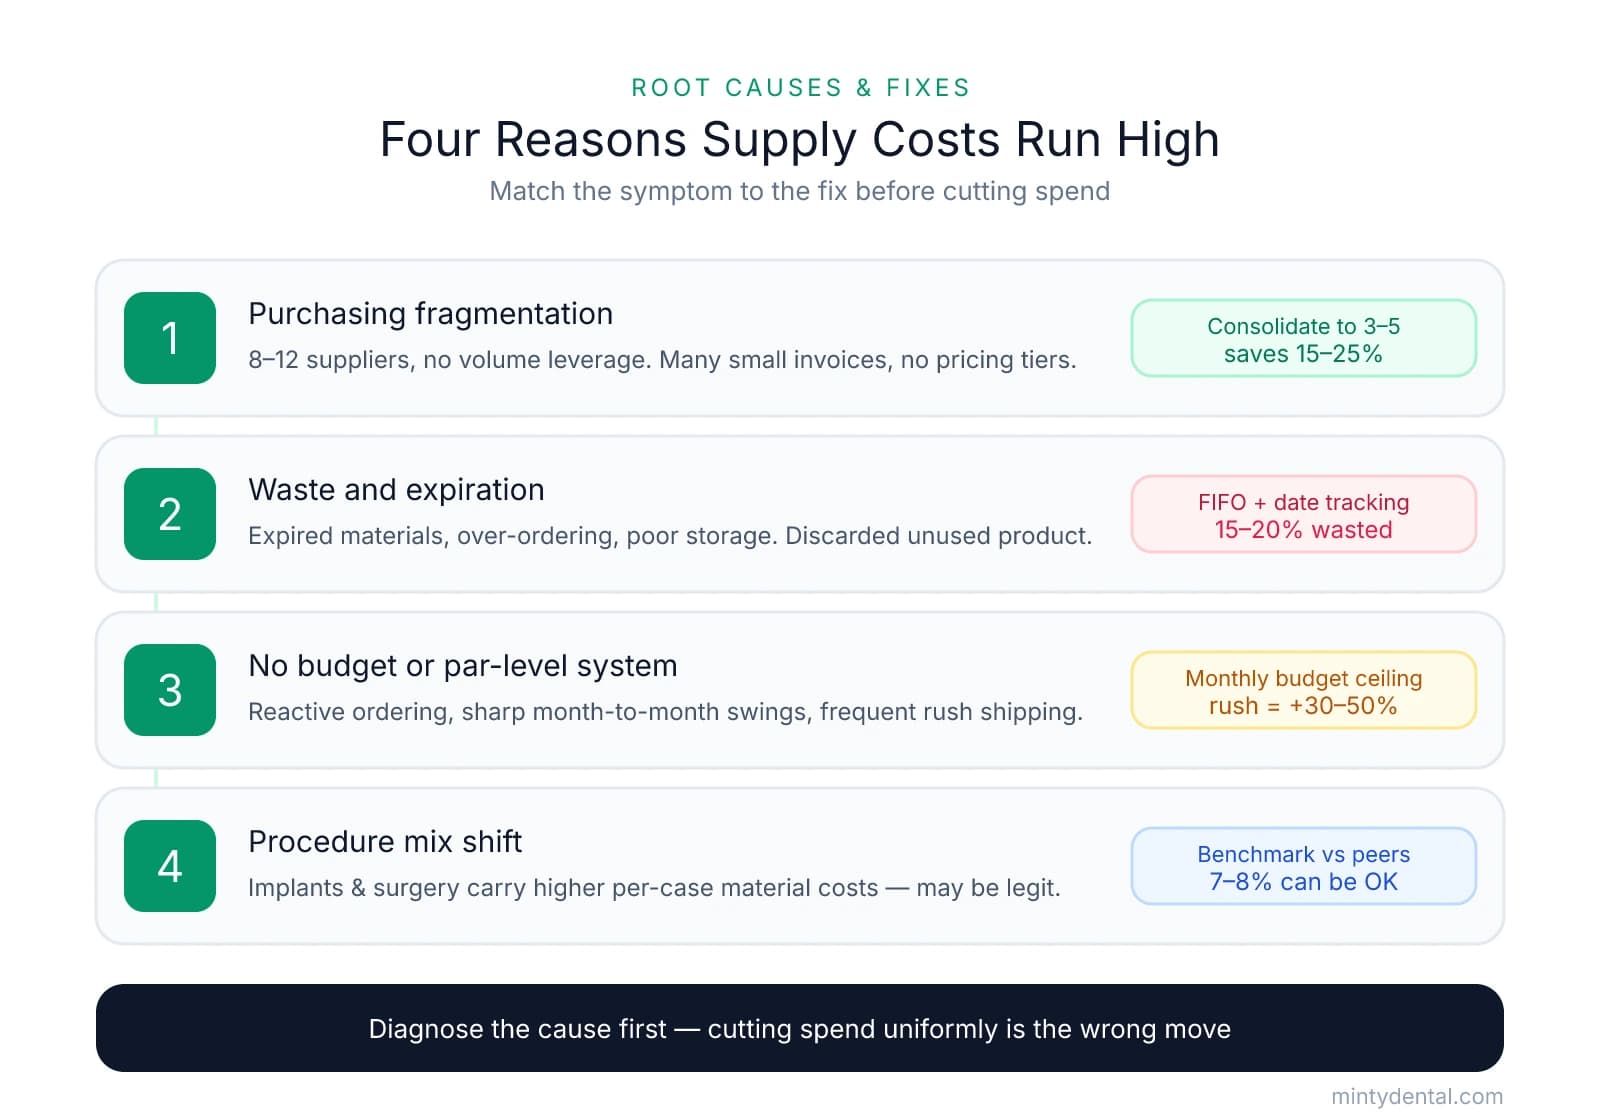
Once the category is clean and the number still sits above benchmark, the next step is identifying the cause before choosing a response. Most inflated supply percentages trace to one of four root causes, and each calls for a different fix. Cutting spend uniformly across the board is the wrong move when the real driver is vendor fragmentation or a procedure mix shift. Reading through the four causes below, most owners can identify which one, or which combination, matches their situation.
-
Purchasing fragmentation. The average practice maintains relationships with 8 to 12 different suppliers, each with its own ordering system, contract cycle, and minimum order threshold. That spread prevents any single vendor from seeing enough volume to offer meaningful pricing, and reactive ordering across many accounts makes it hard to track what the practice actually pays. Consolidating to 3 to 5 primary suppliers through a dental GPO or direct volume negotiation typically reduces supply costs 15% to 25%. The symptom to look for is many small invoices from many vendors with no consolidated pricing tiers.
-
Waste and expiration. Practices waste an average of 15% to 20% of their supply budget annually through expired materials, over-ordering, and inefficient storage. The response here is operational rather than contractual: first-in-first-out (FIFO) rotation, so older stock is used before newer stock, and expiration date tracking so materials are flagged before they lapse. The symptom is discarded unused product and recurring over-ordering of items the practice does not turn over quickly.
-
No budget or par-level system. When ordering is driven by whoever notices a shortage rather than a planned schedule, the practice buys reactively, which produces emergency rush orders that typically cost 30% to 50% more than planned purchases. A monthly supply budget tied to the prior month's collections, consistent with the working ceiling noted earlier, gives the practice a measurable spending limit and a reason to order on a schedule. The symptom is spend that swings sharply month to month with frequent expedited shipping charges.
-
Procedure mix shift. A practice that has added implants, oral surgery, or cosmetic services will legitimately run higher supply costs per dollar of production, because those cases carry higher per-case material costs. What tends to happen is the percentage rises without any purchasing problem at all. A supply figure of 7% to 8% may be appropriate for a practice doing heavy restorative or surgical work, and interpreting the benchmark without accounting for the service mix can send an owner chasing savings that do not exist. The appropriate response is to confirm the mix explains the gap, then benchmark against similar practices rather than a general-dentistry average.
A Practical Reduction Plan: What to Do in the Next 30 Days
The previous sections built the diagnosis. This closing framework sequences it into four steps an owner can start this week, moving from verification to action in order so that effort lands where it changes the number.
Step 1: Clean the category before you judge it. Pull 12 months of supply spend and confirm only chairside clinical consumables sit in the line. Recategorize lab fees, office and administrative supplies, and capital equipment if they have drifted in. This step alone resolves a meaningful share of high percentages, and it costs nothing but an hour with your bookkeeper.
Step 2: Benchmark the corrected figure. With the category clean, recalculate against net production or collections. If the result lands below 7%, supplies are likely not where your overhead problem lives, and your time is better spent reviewing other categories. Owners working through a broader cost review often find a more productive target when they examine which overhead line to cut first rather than squeezing a line already in range.
Step 3: Identify the root cause. If the corrected number sits above 7% to 8%, match it to one of the four causes from the prior section before acting. Many small invoices from many vendors point to fragmentation. Discarded product points to waste. Sharp month-to-month swings point to reactive ordering. A higher-acuity case mix may explain the gap entirely.
Step 4: Apply the matching lever. Vendor consolidation or GPO participation addresses fragmentation. FIFO rotation and par levels address waste. A monthly budget ceiling, set near 6% of the prior month's collections as a starting point, addresses reactive ordering.
One caveat shapes the 2026 baseline. Because dental supply prices rose 6% in the year ending February 2026, roughly four points above general inflation, a practice that ran 6% two years ago may now be running 7% to 8% against a budget set in 2023. The response in that case is to renegotiate vendor pricing or find comparable domestic-sourced alternatives, not to cut clinical quality. Setting a specific, measurable supply budget gives those negotiations a concrete target.
Supply costs reward deliberate management faster than most overhead lines. Moving from 9% to 6% on a $1M practice recovers roughly $30,000 in annual profit without touching fees, staffing, or patient volume.
Sources & References
The data and claims in this article are drawn from the following sources. We prioritize government data, peer-reviewed research, and established industry publications to ensure accuracy.
- Dental Supply Costs: What a 1.4-Point Gap Actually Costs You— dsocfo.comIndustry
- Cost of dental equipment, supplies up 6%— www.beckersdental.com
- Supply Cost Percentage for Dental Practices: Benchmarks and Red Flags— reciprocityaccounting.comIndustry
- Dental Inventory Management: Vendor Consolidation Strategies— www.arini.ai
- Reducing Dental Supply Waste and Expiration Loss - TGP— tgpo.ioIndustry
- 4 ways to cut dental supply costs and stay competitive— www.dentaleconomics.comIndustry
Ready to optimize your practice's supply spending?
Benchmarking is just the first step. Minty's operations team helps independent practices streamline costs across all business functions, from supplies to staffing to technology, so you can focus on patient care.