Dental Practice Overhead Too High? Where to Cut First

Co-Founder, Minty Dental

In Summary
- Dental practice overhead includes all operating expenses except owner compensation, expressed as a percentage of collections (not production).
- The national median overhead sits around 62% of collections; top-performing practices run 55-60%; overhead above 70% signals a profitability problem requiring immediate attention.
- A 5-point overhead reduction on a $1 million practice adds $50,000 to owner take-home without treating a single additional patient.
- Total overhead percentage alone does not tell you where to act — a category-level breakdown across personnel, supplies, lab fees, facility, and administrative costs is required before making any cuts.
- Each category has its own benchmark range and warning threshold; the goal of this diagnostic step is to identify which line is out of range, not to cut across the board.
Benchmark Each Category Before Deciding What to Cut
Dental practice overhead is the sum of all operating expenses required to run a practice, excluding owner compensation, expressed as a percentage of gross collections. Collections, not production, is the correct denominator because write-offs, adjustments, and insurance discounts mean production figures overstate the revenue actually available to cover expenses.
The national median overhead sits around 62% of collections, per American Dental Association data. Top-performing practices tend to operate in the 55-60% range through disciplined cost management, while overhead above 70% signals a profitability problem that warrants immediate attention. Overhead below 55% can also be a concern, often indicating underinvestment in staff, technology, or patient care resources.
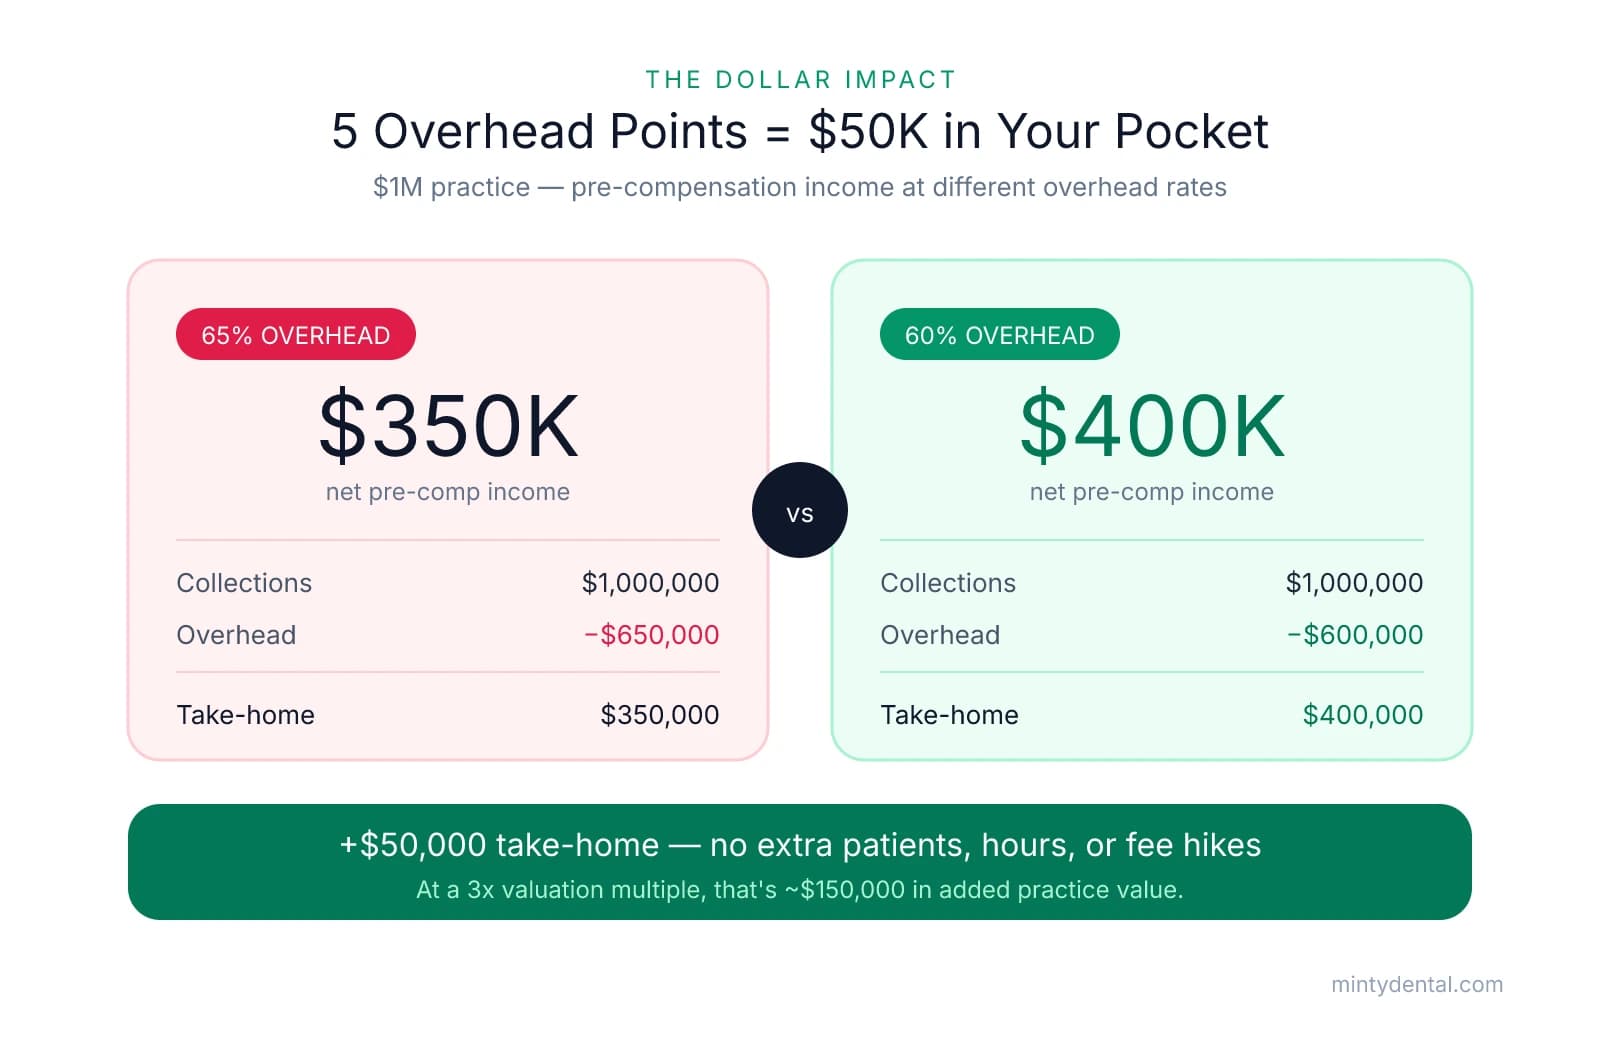
The dollar impact of overhead reduction: A practice collecting $1 million annually at 65% overhead nets $350,000 in pre-compensation income. The same practice at 60% overhead nets $400,000. That $50,000 difference comes entirely from tightening expenses, with no additional patients, no extended hours, and no fee increases.
The challenge is that a single overhead percentage tells you something is wrong without telling you where to look. Two practices can both report 67% overhead while facing completely different problems: one may be overstaffed, the other may be paying above-market rent. Acting on the total figure without a category breakdown risks cutting in the wrong place.
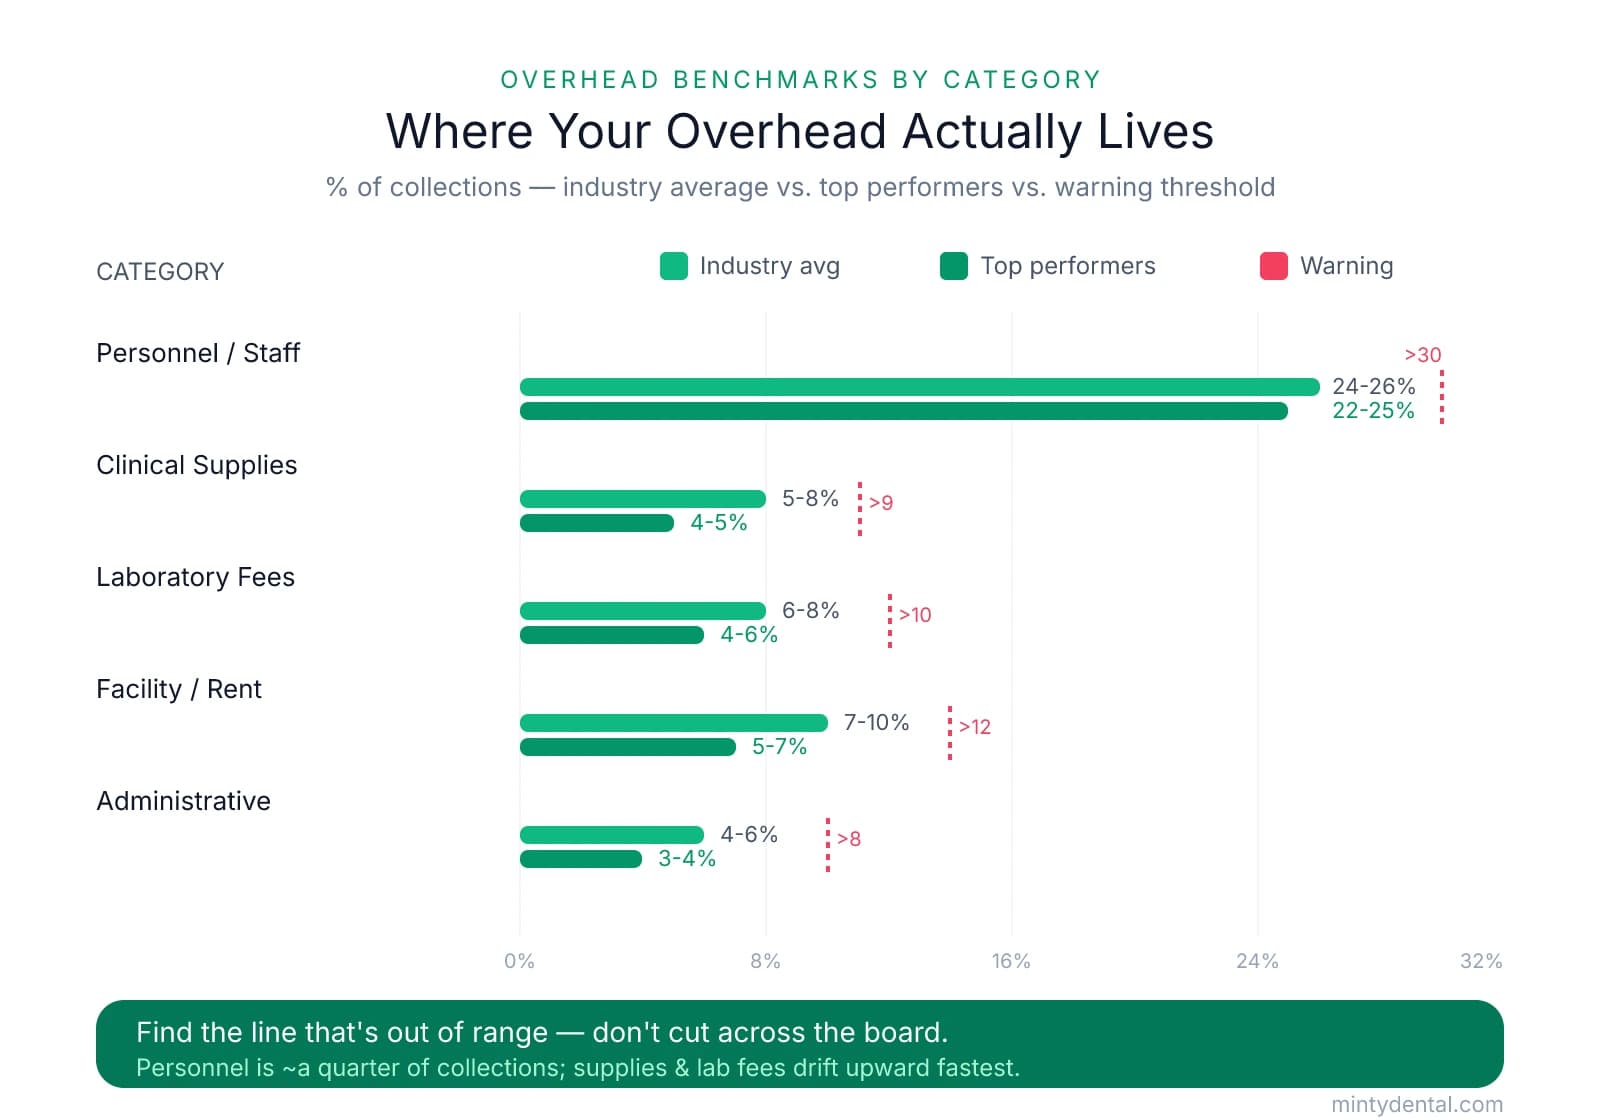
To calculate each category's percentage, divide the annual spend in that category by gross collections, then multiply by 100. Running this calculation across five core expense categories gives you a diagnostic map of where your overhead actually lives.
| Expense Category | Industry Average | Top Performers | Warning Threshold |
|---|---|---|---|
| Personnel / Staff Costs | 24-26% | 22-25% | >30% |
| Clinical Supplies | 5-8% | 4-5% | >9% |
| Laboratory Fees | 6-8% | 4-6% | >10% |
| Facility / Rent | 7-10% | 5-7% | >12% |
| Administrative / Other | 4-6% | 3-4% | >8% |
Source: DentiMax 2026 Dental Office Overhead Report
Personnel is consistently the largest single category, representing roughly a quarter of collections in the average practice. Clinical supplies and lab fees are the categories most likely to drift upward without obvious cause, often due to inconsistent vendor pricing or ordering habits. Facility costs are largely fixed once a lease is signed, making them important to evaluate before renewal rather than after. Administrative expenses tend to be diffuse and are frequently underreported when owners pull numbers quickly.
Complete this category-level calculation using at least two to three years of data before drawing conclusions. A single year can reflect one-time events, a staff departure, or a supply backorder that skews the numbers. Owners working through a P&L for the first time may find it useful to review how each line item maps to practice operations before categorizing expenses.
The sections that follow address each category in sequence, starting with the ones that offer the largest and most reversible reductions.
Staffing Costs: The Largest Category and the Hardest to Cut Well
Personnel costs are the natural starting point once a category-level diagnostic confirms overhead is elevated, because staffing represents the largest single expense in most practices. According to the ADA/HPI 2025 outlook, staffing pressures remain the top challenge practice owners expect to face, which means this category requires careful analysis before any action is taken.
The benchmark to work toward: Top-performing practices run personnel costs at 22-25% of collections. The industry average sits at 24-26%, and anything above 30% warrants a structured review. Most practices reach the target range through scheduling and role adjustments rather than reductions in headcount.
Evaluate Productivity Before Headcount
The most useful diagnostic metric in this category is production per full-time equivalent (FTE) employee. Divide total annual production by the number of FTEs on staff, counting part-time employees proportionally. Practices generating $200,000 or more in production per FTE are generally well-staffed relative to their output. Practices running significantly below that threshold often have a scheduling problem rather than a headcount problem.
The distinction matters because the solutions differ. A staffing cost problem, where the practice has more people than patient volume can support, may call for reducing hours or consolidating roles. A scheduling problem, where team members are present but underutilized because of open chair time or uneven day-of-week volume, is better addressed by tightening the schedule and filling gaps in the appointment book. Cutting staff in the second scenario reduces capacity without addressing the underlying inefficiency.
Before drawing conclusions, consider these evaluation questions:
- Are hygienists carrying a full schedule, or is there consistent open time on certain days?
- Are assistants routinely idle between procedures, or is idle time concentrated in specific sessions?
- Do staffing levels on slower days (often Mondays and Fridays) match actual patient volume?
- Are any roles duplicated, or are responsibilities distributed in a way that creates overlap?
Benefits Costs Deserve a Separate Review
Base wages are the most visible part of the staffing line, but health insurance premiums and retirement contributions are often overlooked contributors to an elevated percentage. These costs can add 15-20% on top of base wages without appearing prominently in a quick P&L review. Benchmarking benefits against local market rates annually is practical, particularly as group health plan costs have increased steadily across most markets.
For practices that employ an associate dentist, compensation structure adds another layer of complexity. Associate pay arrangements vary significantly by model, and a misaligned structure can push personnel costs above the warning threshold on its own. A dental associate compensation calculator can help owners evaluate whether the current arrangement is within a reasonable range relative to the associate's production.
The goal in this category is not to minimize headcount. It is to ensure that hours, roles, and compensation are aligned with the production the practice is actually generating.
Clinical Supplies and Lab Fees: The Most Controllable Variable Costs
Where staffing costs require careful analysis before any changes are made, clinical supplies and lab fees offer a more immediate path to overhead reduction. Both are variable costs that scale with patient volume and can be adjusted without the organizational complexity that comes with staffing decisions.
Combined benchmark: Clinical supplies and lab fees together typically represent 11-16% of collections in a well-run practice. When the two categories are above that range, the practice is often leaving recoverable margin on the table. According to Dental Economics, careful management of supplies and lab expenses can add tens of thousands of dollars to a practice's bottom line annually.
Clinical Supplies: Benchmark 5-8%, Warning Threshold Above 9%
Supply overspend rarely comes from a single large purchase. It accumulates through ordering habits: emergency orders placed at premium prices when stock runs low, expired or overstocked inventory that ties up cash in materials that never get used, and purchases split across multiple distributors without consolidating volume.
That last pattern is worth examining closely. When a practice divides purchasing among several vendors to chase individual item discounts, each distributor receives only a fraction of the total business and has limited incentive to hold prices down. Consolidating to a primary distributor gives that vendor 100% of the practice's supply spend, which creates a stronger basis for negotiating better pricing and service terms.
For independent practices that want enterprise-level pricing without joining a DSO, group purchasing organizations (GPOs) are a practical alternative. Industry data from the Private Dental Alliance shows that well-structured GPOs help independent practices reduce supply costs by 15-30% by aggregating purchasing volume across hundreds of practices. Members retain full ownership and clinical autonomy while accessing pricing tiers typically available only to large corporate groups.
A useful starting point is to pull the last 12 months of supply invoices, calculate the category as a percentage of collections, and identify whether overspend is concentrated in specific product categories or distributed broadly. Broad overspend often points to a distributor relationship issue; concentrated overspend often points to a specific ordering or inventory management habit.
Lab Fees: Benchmark 6-8%, Warning Threshold Above 10%
Lab fee overspend tends to follow a different pattern. The most common causes are using premium labs for routine restorative cases where a mid-tier lab would produce clinically equivalent results, and not renegotiating per-unit rates as case volume grows. Labs have an incentive to retain high-volume accounts, and many owners simply never ask for a rate review.
Reviewing lab invoices quarterly rather than annually gives owners a clearer picture of per-unit costs by procedure type. Comparing those figures against current market rates for the same case types is a straightforward way to identify whether the current lab relationship is competitively priced.
For practices with high crown volume, in-house milling is worth evaluating as a longer-term option. Whether it makes financial sense depends on current lab fees per crown, monthly case volume, and how quickly the equipment investment can be recovered. Owners considering this path can use a break-even calculation based on their current per-unit lab cost and projected monthly case count before committing.
Why These Cuts Come First
Supply and lab reductions are the most reversible changes available to a practice owner. If a distributor switch affects product quality or a new lab relationship produces inconsistent results, the change can be undone without the organizational disruption that comes with staffing adjustments. That reversibility makes this category the right place to start when overhead needs to come down and the diagnostic work has confirmed these lines are above their benchmarks.
Sequencing Your Overhead Reduction: Where to Start and What to Protect
The guidance above points toward a consistent principle: start with the categories that are furthest above benchmark and most reversible, not the ones that feel easiest to address. Cutting marketing spend or deferring equipment maintenance may look like quick wins on a P&L, but both create compounding costs that show up later in reduced new patient flow and deferred repair bills.
A practical sequence for most practices:
-
Run the category-level benchmark comparison. Calculate each expense category as a percentage of gross collections and compare it against the warning thresholds in the table above. This step identifies which lines are actually out of range and prevents action based on the total overhead figure alone.
-
Address supply and lab overages first. If clinical supplies are above 9% or lab fees are above 10%, these are the highest-priority targets. Both are variable, reversible, and adjustable without affecting team structure or patient-facing service. Consolidating vendors, joining a GPO, or renegotiating lab rates can be implemented within a billing cycle and reversed if results are unsatisfactory.
-
Evaluate staffing through scheduling efficiency before considering headcount. If personnel costs exceed 30% of collections, calculate production per FTE before drawing conclusions. In many cases, the problem is scheduling utilization rather than overstaffing, and the solution is filling open chair time rather than reducing roles. Headcount reductions carry real organizational costs and should follow a thorough scheduling analysis.
-
Treat facility costs as a long-term lever. If rent exceeds 12% of collections, options are limited until the lease comes up for renewal. Renegotiating at renewal, subletting unused operatory space, or consolidating to fewer operating days are the realistic paths, and each requires planning well in advance of the renewal date.
What not to cut: Marketing spend below 3% of collections is already underinvestment. Reducing it further restricts new patient flow, which compounds the overhead problem by shrinking the revenue base. Equipment maintenance deferrals create a similar dynamic: deferred costs accumulate and tend to arrive as larger, unplanned expenses.
The valuation case for overhead discipline is direct. Each percentage point of overhead reduction is a point of EBITDA, and EBITDA drives practice valuation multiples. A practice that reduces overhead from 68% to 63% on $1 million in collections adds $50,000 to annual earnings. At a 3x valuation multiple, that translates to approximately $150,000 in additional practice value. Owners thinking about a future transition can find a fuller treatment of this relationship in the guide on increasing practice value before selling.
Overhead management works best as a quarterly review process. Practices that compare category-level percentages against benchmarks every quarter can catch drift early, before a single elevated line becomes a structural problem. Waiting until cash flow tightens to examine overhead typically means the problem has been compounding for months, with fewer options available to address it.
Sources & References
The data and claims in this article are drawn from the following sources. We prioritize government data, peer-reviewed research, and established industry publications to ensure accuracy.
- Average Dental Practice Overhead: Benchmarks and Insights - Overjet— www.overjet.com
- Dental Office Overhead Percentages: 2026 Report - DentiMax— dentimax.comIndustry
- Ask the Expert: Practical strategies to reduce dental practice expenses— adanews.ada.orgIndustry
- Tips to reduce dental practice overhead (without compromising ...— www.dentaleconomics.comIndustry
- Dental Group Purchasing Organization ROI Analysis 2026— privatedentalalliance.comIndustry
Ready to optimize your practice finances?
Cutting overhead is just the first step. Minty's operations team handles billing, marketing, and technology so you can focus on patient care while reducing costs systematically across your entire practice.