How to Track Which Marketing Channel Brings New Dental Patients

Co-Founder, Minty Dental

In Summary
- Most marketing reports measure activity (impressions, clicks, form fills, cost per lead), none of which confirms a new patient was actually seen in the chair.
- The more useful metric is cost per completed new-patient visit: total channel spend divided by the number of new patients who booked, showed up, and were seen.
- This metric captures the handoff between marketing and operations, including scheduling availability, insurance fit, reminder systems, and no-show rates.
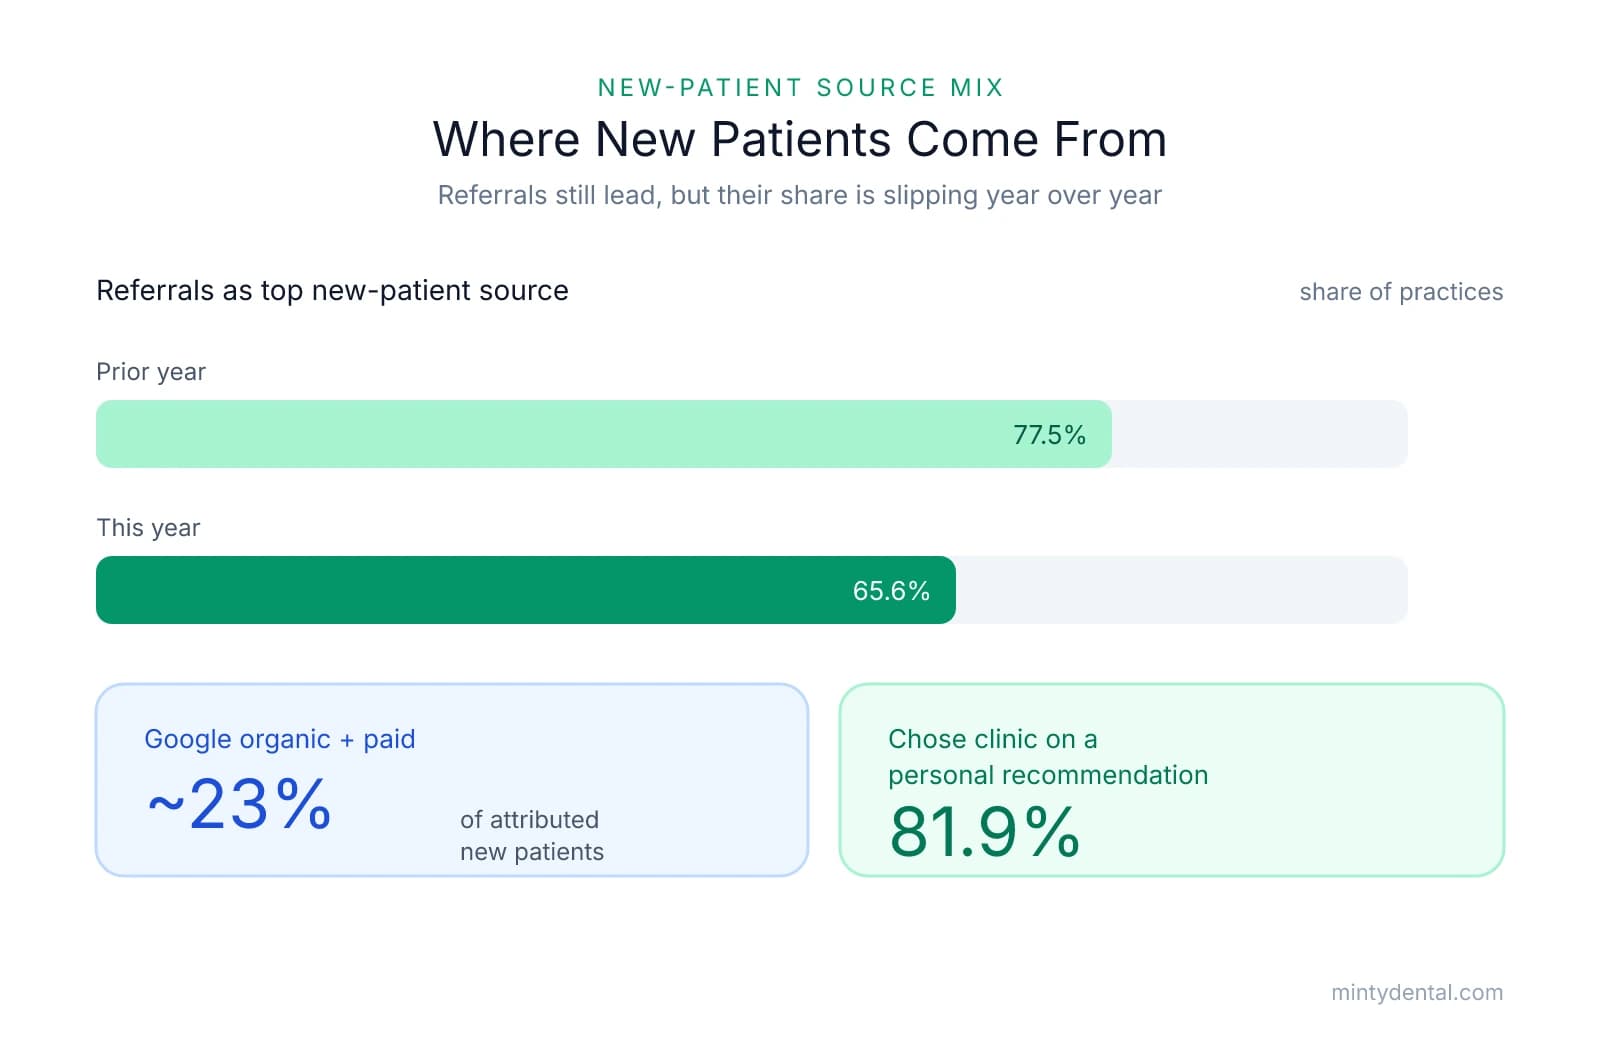
- Referrals remain the top new-patient source for 65.6% of practices, down from 77.5% a year earlier, while Google organic and paid now account for nearly 23% of attributed new patients.
- Practices that track by completed visit tend to fund the channel that fills the schedule rather than the one that fills the voicemail.
Clicks and Leads Are Not the Same as Patients in Chairs
Most practices evaluate marketing by the metrics their agency reports: impressions, clicks, phone calls, form submissions, and cost per lead. These activity metrics are useful for spotting whether a campaign is reaching people, but none of them confirms that a patient actually sat in the chair and was seen by a provider. That leaves a reporting gap between marketing activity and completed new-patient visits.
The disconnect shows up in the details of each lead. A Google Ads click may come from someone comparing prices across three nearby offices. A form submission may be entered, then canceled before the appointment, or missed entirely by a busy front desk. A phone lead may be asking about a service the practice does not offer. Each of these registers as marketing activity, yet produces no revenue.
Cost per completed new-patient visit is the total spend on a marketing channel divided by the number of new patients from that channel who booked an appointment, showed up, and were seen by the provider. This measure differs from cost per lead because it accounts for the full handoff between marketing and operations: response time, scheduling availability, insurance fit, appointment reminders, and no-show rates. A channel that generates cheap leads can still produce expensive patients if those leads rarely convert into completed visits.
Tracking at the channel level has become more relevant as the new-patient mix shifts. Referrals remain the top new-patient source for 65.6% of practices, down from 77.5% the prior year, while Google organic and paid together now account for nearly 23% of attributed new patients. When acquisition is spread across more channels, averaging spend across all of them hides which ones are actually working.
Without a completed-visit view, practices often keep funding the channel that fills the voicemail rather than the one that fills the schedule. The front desk plays a central role in that conversion, and the volume of new-patient calls a practice mishandles can quietly distort which channel looks effective.
The Three-Layer System That Captures Every Patient's Source
Reliable source data comes from three layers working together. Each covers a gap the others leave open: intake capture records what the patient tells you, call tracking records the source automatically for phone bookings, and the practice management system ties that source to the patient record so it survives past the first visit. Digital-only tracking misses phone bookings entirely, and intake forms alone miss patients who never self-report accurately, so no single layer is sufficient.
Layer 1 is intake capture. Every new patient form should include a required "how did you hear about us?" field with specific options rather than a blank text box. Useful options include Google search, Google Ads, patient referral, insurance directory, social media, direct mail, and drove by. A blank box produces vague entries like "internet" that cannot be sorted by channel. The front desk verbal question matters just as much, because the phrasing changes the answer. "Did you find us on Google?" invites a yes from almost everyone, while an open question like "What made you call us today?" surfaces referral and offline sources that digital tracking never sees. To verify this layer, listen to five recorded calls and count how many used an open-ended question.
Layer 2 is call tracking. Dynamic number insertion assigns a unique phone number to each channel, such as your website, Google Ads, Google Business Profile, and direct mail. When a patient calls, tools like CallRail or WhatConverts log which number they dialed and record the source automatically, without relying on staff memory or the patient's recall. A meaningful share of dental appointments are still booked by phone, especially higher-value cases where patients want to ask about cost or sedation before committing, which makes call tracking the highest-leverage tracking investment for most general practices.
Layer 3 is linkage to the practice management system. Dentrix, Eaglesoft, Open Dental, and similar platforms include a referral source field, but it often goes unused or is filled inconsistently. Populating it for every new patient keeps source data attached to the record so you can later connect it to production. UTM parameters support the same goal on the digital side: adding them to every paid link, email link, and social bio link prevents Google Analytics from lumping paid traffic, email, and directory referrals into an undifferentiated "direct" bucket. Most modern scheduling tools can pass those parameters through to the appointment record, though most practices never turn the feature on.
To check whether the full system is working, pull last month's new patient records and count how many have a blank source field. Under 10% blank is a reasonable target for a practice running all three layers.
How to Compare Channels Once You Have the Data
Compare channels on the same basis: cost per completed visit, or total spend on a channel over a defined period divided by the number of new patients from that channel who completed their first appointment. Using completed visits rather than leads removes the distortion created by no-shows and cancellations, which vary widely by channel.
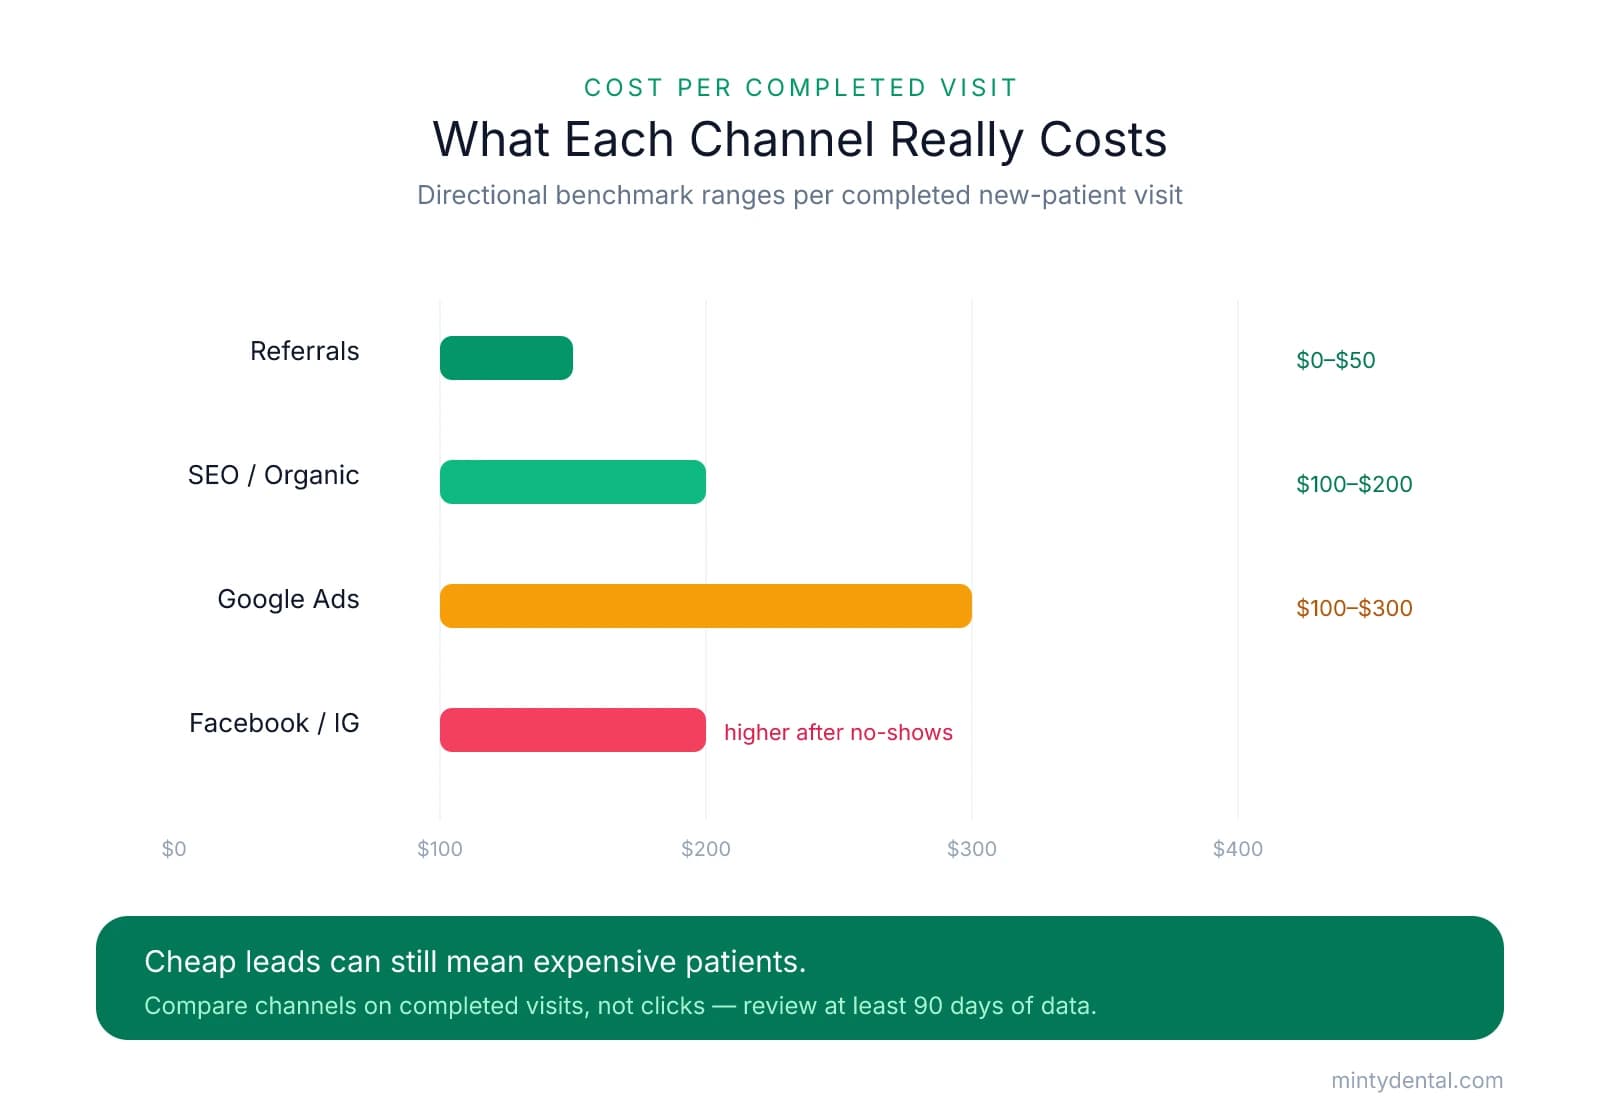
Benchmark ranges give a rough sense of where each channel tends to land, though your own numbers will differ by market and specialty. Treat these as directional sanity checks rather than targets.
| Channel | Typical cost per lead | Typical cost per completed visit | Patient quality notes |
|---|---|---|---|
| Referrals | $0 to $50 | $0 to $50 | High trust, high show rate; 81.9% of patients chose their clinic on a personal recommendation |
| Organic search / SEO | Lower, varies | $100 to $200 | Patients often researching, mixed case value |
| Google Ads | $50 to $108 general, higher for implants | $100 to $300 | Depends heavily on front-desk conversion |
| Facebook / Instagram | $76 to $212 per lead | Higher after no-shows | More price-shopping, variable show rate |
First-touch attribution is the most practical model for most single-location practices. It gives full credit to the channel that first brought the patient in, which helps identify which channels are best at generating awareness and new patient acquisition. The model is imperfect because many patients touch several channels before booking, but it is consistent and actionable. Multi-touch attribution distributes credit across every interaction and gives a fuller picture, but most practices find it too complex to maintain without dedicated analytics software and staff.
Volume and quality are separate questions. A channel that produces 10 implant patients can outperform one that produces 30 hygiene-only patients, because the production per patient differs by an order of magnitude. When you compare channels, pull the total treatment production tied to each source, not just the headcount, and weigh that against production per hour across your schedule.
Referrals deserve their own category. Direct cost is near zero, but without consistent source capture, referral momentum stays invisible until it has already declined. Tracking which patients, specialists, and community contacts are still sending new patients tells you where to reinvest attention.
Review at least 90 days of channel data before making budget decisions. Month-to-month swings in a single channel are usually noise rather than a durable trend.
Building a Monthly Source Report You'll Actually Use
The tracking system only pays off if someone reviews it on a regular cadence and acts on what it shows. A monthly review built on source, call-tracking, and completion data you already collect takes most owners under an hour and helps guide budget decisions.
Start with the new patient source report built into your practice management software. Dentrix, Eaglesoft, and Open Dental each include a referral source report that lists new patients by the source field discussed earlier. Pull it monthly and compare three views: this month, last month, and the same month last year. The year-over-year view matters because new patient flow is seasonal in most markets, and comparing August to July can mislead when August is slow every year.
Supplement the software report with your call tracking data. The source report captures what staff recorded at intake, while call tracking captures phone-booked patients whose source was logged digitally. Combining the two gives a view of completed visits by channel that neither produces alone.
Each month, work through five questions:
- Which channel produced the most completed visits?
- Which channel's cost per completed visit changed by more than 20% from the prior period?
- Is referral volume holding steady, growing, or declining?
- What percentage of new patient records have a blank source field?
- Are any channels producing high inquiry volume but low show rates?
Question four is a data check, not a marketing result. A blank source rate above 10 to 15% usually points to a front desk or intake form problem rather than a weak channel. Correct the data collection before you change the budget, because decisions built on incomplete source data tend to cut the wrong channel.
Practices that keep clean, consistent source data for 12 to 24 months can spot seasonal patterns by channel and allocate budget ahead of predictable peaks and lulls, which also helps when filling open schedule time without resorting to discounts. Tracking this way also means keeping cost per lead and cost per new patient visible separately, since a channel can generate strong inquiry volume while still underperforming on completed visits and revenue.
Documented source data carries value beyond the marketing budget. An owner who can show a diversified, consistent acquisition mix across several channels presents a lower-risk growth profile to buyers, lenders, and prospective associates than one who relies on a single channel or cannot explain where patients come from. That documentation is one of the quieter ways to strengthen practice value before a sale.
Sources & References
The data and claims in this article are drawn from the following sources. We prioritize government data, peer-reviewed research, and established industry publications to ensure accuracy.
- How to Track Dental Marketing Attribution - bookmysmile— bookmysmile.aiIndustry
- Dental Practice Marketing in 2026 - MouthWatch— mouthwatch.com
- Marketing ROI Tracking for Dental Practices - Patient Procure— patientprocure.com
- Dental Lead Attribution Software for Dental Growth - ConvertLens— convertlens.com
- Google Ads vs SEO vs Referrals: Cost Per Patient (2026) - The Dental Signal— www.thedentalsignal.com
- Dental Marketing ROI Tracking: 5 Proven Methods 2025— sharedpracticespodcast.com
- Track ROI on Your Dental Marketing Campaigns— www.dentalroi.com
Ready to optimize your dental marketing ROI?
Tracking patient sources is just the first step. Minty's operations team handles the complete marketing strategy and execution for independent practices, turning attribution data into consistent new patient growth.