How to Tell If Dental Practice Profitability Is Real or Inflated
Co-Founder, Minty Dental

In Summary
- Tax returns show what a practice reports to the IRS, not what it generates for its owner—reported net income is optimized to minimize tax liability, not showcase value
- Seller Discretionary Earnings (SDE) reveals total economic benefit by adding back owner compensation, personal expenses, one-time costs, interest, and depreciation to pre-tax income
- The gap between reported net income and actual SDE routinely sits at $200K-$400K in well-run practices—where inflated profitability claims take root
- Most general practices sell for 1.5x-2.0x SDE, meaning a $100K error in SDE calculation translates directly to $150K-$200K in purchase price
Understanding What You're Actually Buying
Most buyers treat the seller's tax return as the practice's true profitability. It's not. Tax returns minimize what the IRS sees, not showcase what the business generates. A practice showing $200K in net income might deliver $500K+ in total economic benefit once you account for how the business is structured.
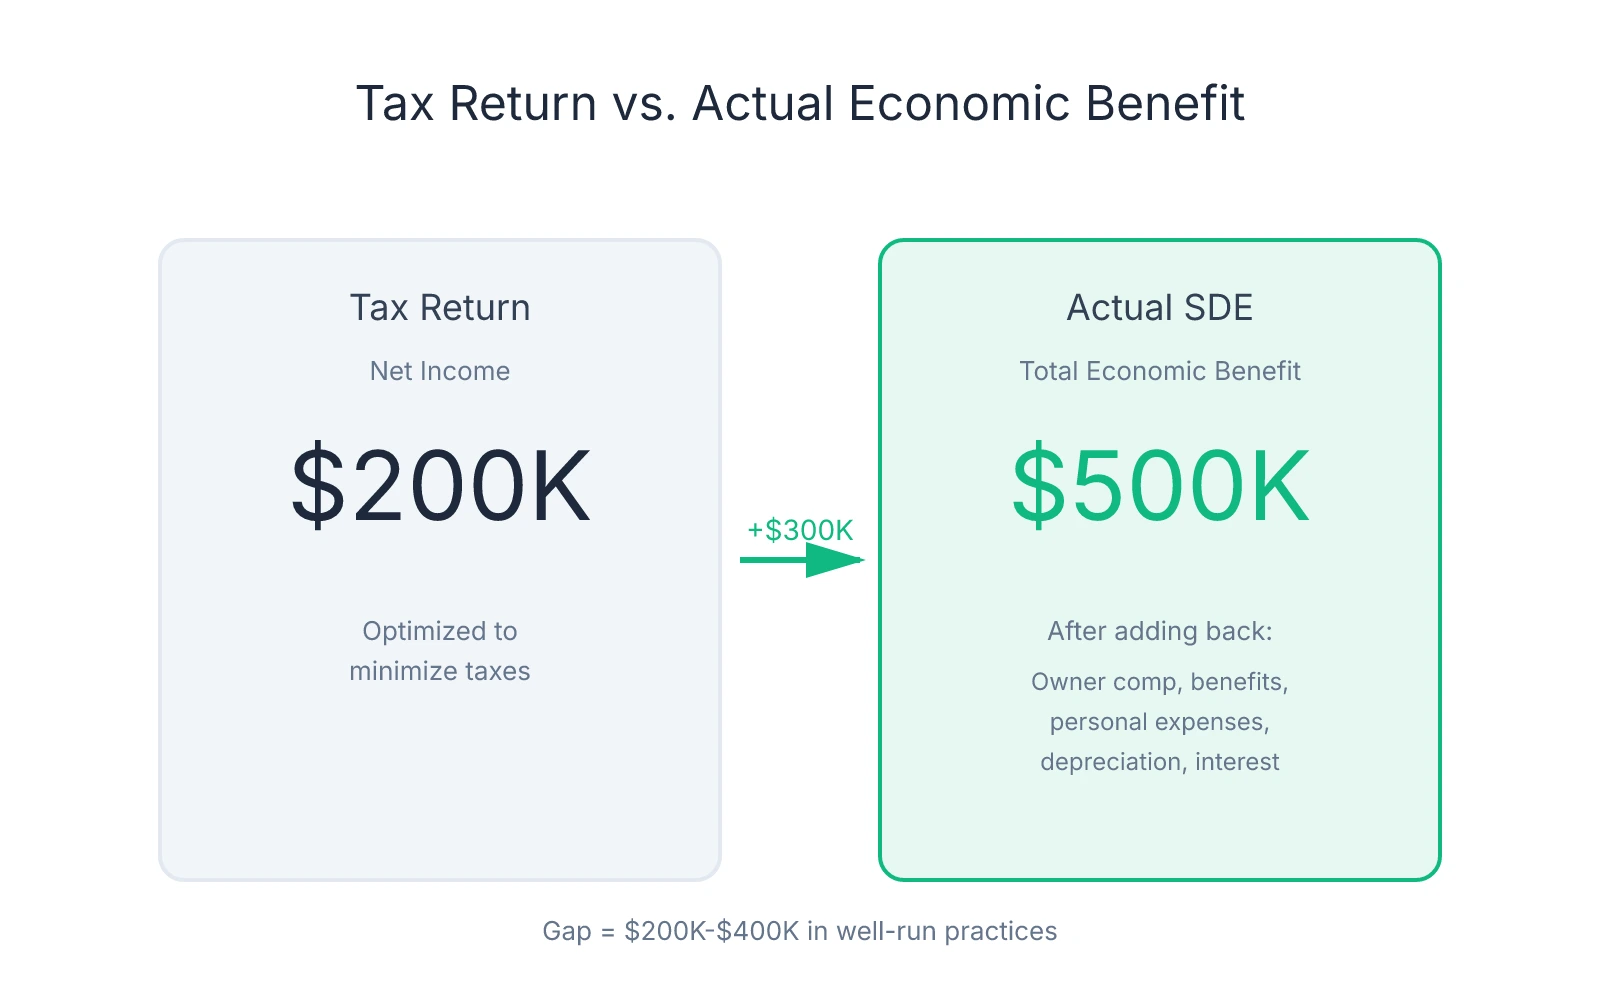
Seller Discretionary Earnings (SDE) answers one question: what total financial benefit did this practice generate for its owner? The formula starts with pre-tax income and adds back everything specific to the current owner—salary, benefits, personal expenses run through the business, one-time costs, interest payments, and non-cash charges like depreciation.
Practices typically sell for 1.5x-2.0x SDE for general practices. If a seller calculates SDE at $500K but the legitimate number is $400K, you're looking at a $150K-$200K difference in purchase price.
The gap between tax returns and SDE exists because most practice owners run their business to minimize taxable income. They pay themselves through W-2 salary and distributions. They run their spouse's salary, car payment, continuing education travel, and retirement contributions through the practice. They expense equipment purchases in the year they're made rather than capitalizing them. This suppresses net income on the tax return, which is why that number alone tells you almost nothing about what the practice generates.
Buyers get burned when sellers add back expenses that shouldn't be added back—or when they fail to verify that add-backs are legitimate. A seller might add back $80K in "owner compensation" when the market rate for replacing their clinical hours with an associate is $120K. They might add back $30K in "one-time consulting fees" that recur annually under different line items. They might add back above-market rent paid to a building they own, inflating SDE while creating a structural cost disadvantage for the buyer.
One pattern worth attention: the larger the gap between reported net income and claimed SDE, the more scrutiny the add-backs deserve. A $150K gap is normal. A $400K gap means the seller is either running an unusually tax-aggressive structure or inflating add-backs to push the valuation higher. Verifying what's actually being added back is where due diligence starts.
The distinction between SDE and EBITDA also matters. EBITDA (Earnings Before Interest, Taxes, Depreciation, and Amortization) assumes the owner is replaced by a market-rate operator and is standard for larger multi-provider practices or DSO acquisitions. For a solo GP or small group practice, SDE is the right metric because it reflects total benefit available to an owner-operator.
The Add-Back Audit: Separating Hard Adjustments from Creative Accounting
The add-back schedule is where most profitability inflation happens. A seller presents an SDE number that looks strong, and buried in the footnotes is a list of adjustments that push reported net income up by $200K, $300K, sometimes more. Some adjustments are legitimate. Others are aggressive interpretations of what counts as "discretionary" or "non-recurring."
The framework: hard add-backs versus soft add-backs. Hard add-backs are universally accepted by buyers, lenders, and quality-of-earnings auditors. Soft add-backs require documentation, justification, and often negotiation.
Hard Add-Backs: Universally Accepted Adjustments
These are non-cash expenses or costs that disappear at closing:
- Depreciation and amortization: Non-cash charges that reduce taxable income but don't affect cash flow
- One-time expenses: Litigation settlements, buildout costs, equipment purchases expensed rather than capitalized—if it recurs annually under different names, it's not legitimate
- Debt service retired at closing: Interest payments on loans the seller pays off with transaction proceeds
- Non-operating income or expenses: Investment gains, rental income from non-practice property, or costs tied to activities outside clinical operations
Hard add-backs rarely exceed 15-20% of reported net income unless the practice has significant depreciation from recent equipment purchases or a one-time event. If hard add-backs alone push SDE up by 40-50%, verify those expenses were truly one-time and not part of an ongoing replacement cycle.
Soft Add-Backs: Where Scrutiny Is Required
Owner compensation normalization is the most contested item. Sellers often add back their entire compensation package—salary, distributions, benefits, retirement contributions—claiming the new owner will structure pay differently.
The legitimate add-back is the delta between the seller's total compensation and what it would cost to replace their clinical hours with an associate. If the seller takes home $320K annually and works full-time clinically, but a market-rate associate costs $180K for the same schedule, the defensible add-back is $140K—not $320K. The $180K is a real cost the buyer will incur. Adding back the full $320K inflates SDE by $180K, which at a 1.75x multiple means a $315K overvaluation.
Request market-rate salary data for associates in the region and calculate replacement cost independently. If the seller's add-back exceeds that delta by more than 10-15%, push back with documentation.
Related-party expenses are another inflation point. If the seller pays their spouse $60K annually for administrative work that could be done by a $40K office manager, the legitimate add-back is $20K—not $60K. If the practice pays above-market rent to a building the seller owns, the add-back is the excess above fair market rent, not the entire lease payment.
Discretionary spending is the softest category. Sellers add back country club memberships, luxury vehicle expenses, travel to conferences in resort destinations, and personal meals run through the business. Some is legitimate—a $5K implant course in Scottsdale is a one-time educational expense. But $30K in annual "continuing education" that includes family travel is a pattern, not a one-time cost.
Some discretionary spending is actually necessary to maintain the practice's reputation or referral relationships. If the seller sponsors local sports teams, hosts patient appreciation events, or maintains memberships that generate referrals, those costs may continue under new ownership.
Documentation Is the Only Defense
For every add-back, request supporting documentation. One-time expenses need receipts and proof they won't recur. Owner compensation claims need payroll records, distribution schedules, and market-rate comparables. Related-party payments need contracts and fair-market benchmarks.
When add-backs exceed 30-40% of reported net income, the seller is either running an unusually tax-aggressive structure or inflating adjustments to push the valuation higher. Request three years of add-back schedules and compare them year-over-year. If "one-time" expenses appear annually, they're not one-time.
Overhead Ratios Reveal What the Seller Won't Tell You
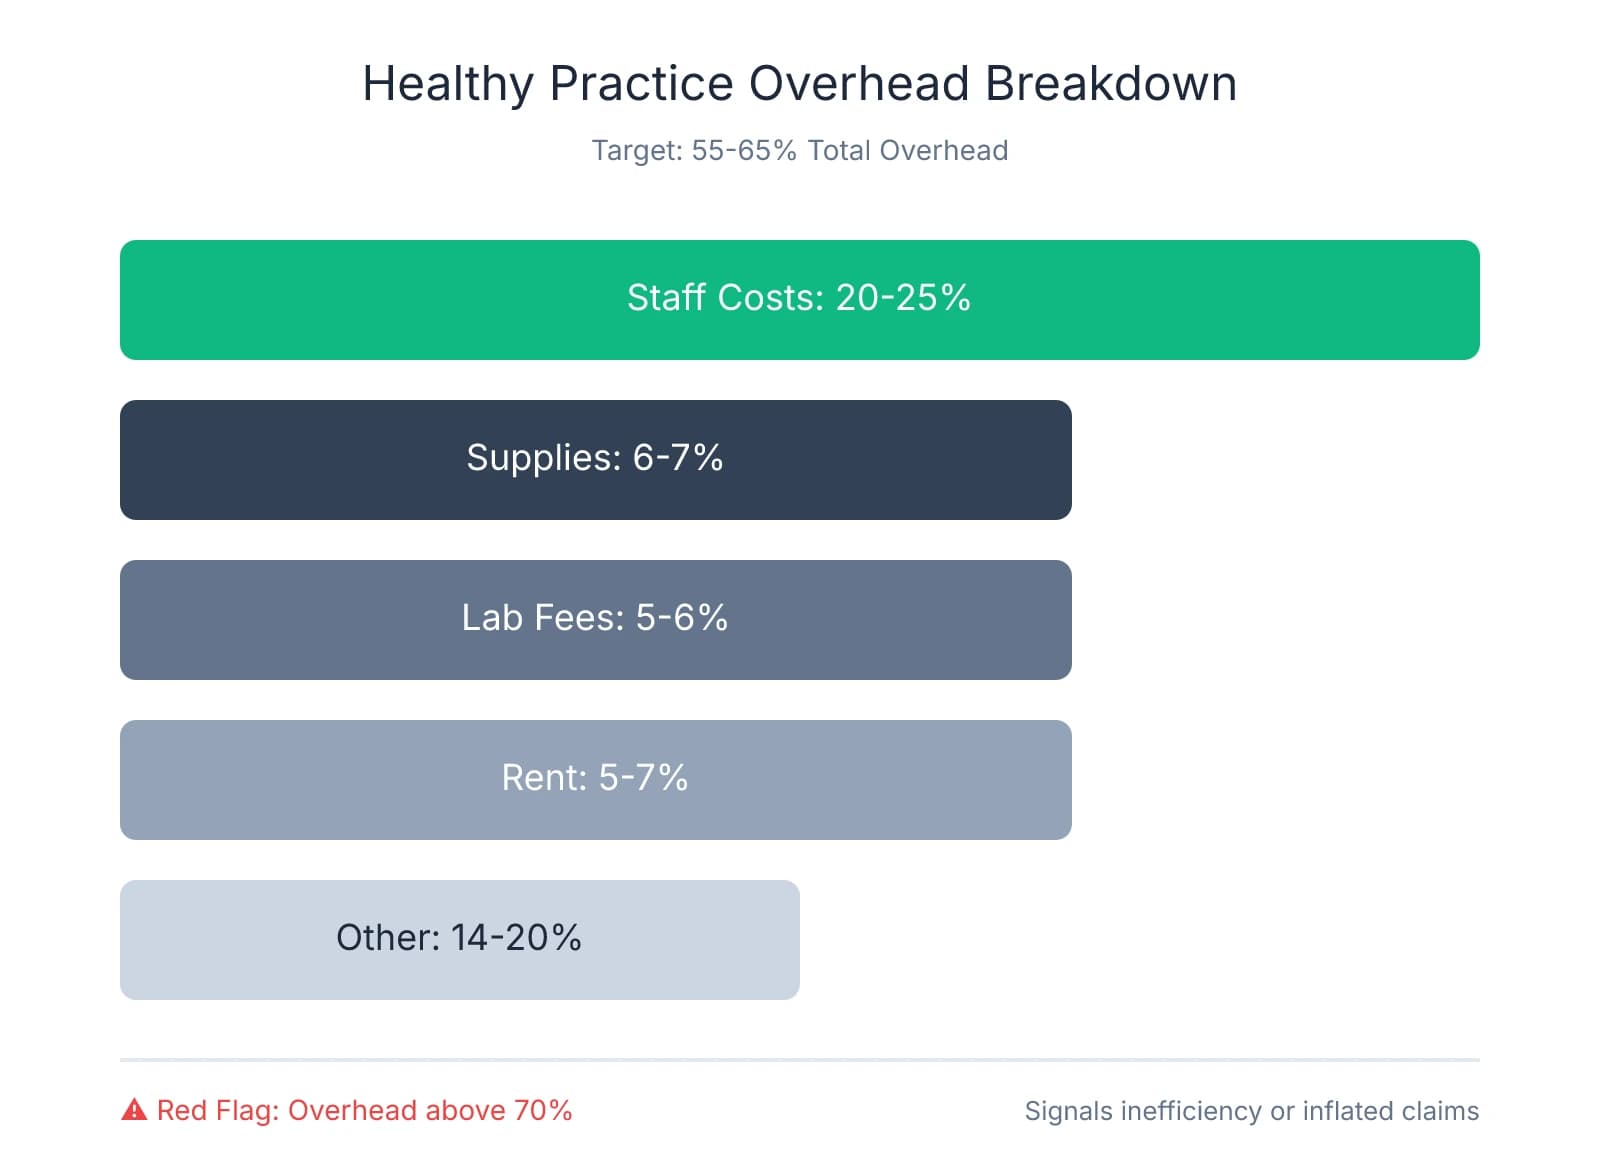
One calculation cuts through profitability claims faster than any other: the overhead ratio. Take total expenses, subtract doctor compensation, divide by total collections. The result tells you what percentage of every dollar collected goes toward running the practice before the owner gets paid. Healthy practices run between 55-65% total overhead. Anything consistently above 70% signals either serious operational inefficiencies or inflated profitability claims.
If a seller claims $400K in profit on $1M in collections, but the P&L shows 72% overhead, the math breaks down. At 72% overhead, $720K goes to expenses before doctor compensation. That leaves $280K—not $400K—for the owner. Either the seller is miscalculating SDE by inflating add-backs, or the practice is running unsustainably lean through deferred maintenance, understaffing, or neglected systems.
Major Overhead Categories and What They Should Cost
Staff costs typically consume 20-25% of total collections—salaries, payroll taxes, benefits, and continuing education. Practices running below 18% are likely understaffed or underpaying. Practices above 27% either have redundant roles or are overstaffed relative to production.
Supplies run 6-7% of collections in well-managed practices. If a practice shows 4-5% supply costs while claiming strong clinical production, they're either getting unsustainable volume discounts that won't transfer, or they're underinvesting in quality materials. Supply costs above 8-9% suggest poor inventory management, excessive waste, or a fee schedule that doesn't support the materials being used.
Lab fees typically sit at 5-6% of collections, varying with case mix. What matters is the ratio relative to clinical mix. If lab fees are 9% but the practice does minimal restorative work, someone is either using premium labs unnecessarily or the fee schedule doesn't cover lab costs.
Rent or occupancy costs should fall between 5-7% of collections. Anything above 8-9% creates structural pressure on profitability. If the seller owns the building and charges above-market rent, that inflates overhead and suppresses SDE artificially. Request lease comparables for similar spaces and adjust the overhead calculation to reflect fair market rent.
Calculate the Ratio and Identify Trends
Pull three years of P&L statements and calculate the overhead ratio for each year: (Total expenses - Doctor compensation) ÷ Total collections. If overhead is improving—68% three years ago, 63% last year, 60% this year—that suggests operational improvements. If overhead is deteriorating—60% three years ago, 65% last year, 70% this year—that reveals hidden problems: rising costs, declining efficiency, or deferred investments catching up.
Stable overhead in the 55-60% range across three years is the cleanest signal. Volatile overhead—jumping from 58% to 72% to 61%—suggests inconsistent management, one-time expenses that weren't truly one-time, or accounting irregularities.
When a seller presents a single year of strong profitability after two years of weak performance, that's not a trend—it's an anomaly. Either the seller made unsustainable cuts to dress up the practice for sale, or they're deferring expenses that will hit you immediately after closing.
Red Flags: High Profitability Claims with 70%+ Overhead
When a practice claims strong profitability but consistently runs 70%+ overhead, one of two things is happening. Either the profitability claim is inflated through aggressive add-backs, or the practice is running unsustainably to suppress costs.
Practices with 72-75% overhead claiming $350K+ in SDE are often adding back expenses that aren't truly discretionary. Run the overhead calculation independently using only hard expenses on the P&L—if the ratio still exceeds 70%, the profitability claim doesn't survive the math.
The other scenario: the seller has cut costs to unsustainable levels to maximize short-term profit before selling. They've deferred equipment maintenance, understaffed the front desk, stopped investing in marketing, or let the facility deteriorate. Overhead looks reasonable on paper, but the moment you take over, you're facing $50K in equipment repairs, a burned-out team that quits within 90 days, and a patient base that's been slowly eroding. Practices showing declining hygiene production ratios often fit this pattern.
Request detailed expense breakdowns for the three largest overhead categories—staff, supplies, and facility costs—and compare them to regional benchmarks. If staff costs are 16% when the market average is 22%, ask why. The answers reveal whether the practice is genuinely efficient or just running lean before the sale.
Your Profitability Verification Checklist
The verification process starts with a document request. Before you accept any profitability claim, you need three years of tax returns, P&L statements, production and collection reports broken down by provider and procedure code, accounts receivable aging reports, current fee schedules, and insurance participation agreements.
Essential Documents and What They Reveal
Tax returns show what the practice reported to the IRS. Request complete federal returns for the past three years, including all schedules. These numbers are optimized to minimize tax liability, which means they understate profitability—but they're also the most reliable baseline because they carry legal consequences for misrepresentation.
P&L statements show the practice's internal accounting. These should match the tax returns in total revenue and major expense categories, but they'll include more granular detail. If the P&L shows significantly higher revenue than the tax return, ask why.
Production and collection reports break down revenue by provider, procedure code, and payer mix. Request these from the practice management software for the past 36 months. These reports reveal whether revenue is concentrated in a few high-value patients, whether collections are consistent with production, and whether the practice's clinical mix supports the claimed profitability.
Accounts receivable aging shows outstanding patient and insurance balances by age category. A healthy practice maintains an A/R ratio around 1.0, meaning total receivables equal roughly one month of average production. If the practice produces $50K monthly and carries $75K in A/R, the ratio is 1.5—a signal of collection problems.
Fee schedules and insurance contracts show what the practice charges and what it actually collects. Compare the fee schedule to regional benchmarks—if the practice claims strong profitability but charges 20% below market rates, the margins don't support the valuation.
Cross-Referencing to Catch Inconsistencies
Tax returns, P&L statements, and bank deposits should tell the same story. When they don't, you've found either an accounting error or intentional inflation.
Compare total revenue on the tax return to total collections on the P&L. These numbers should match within 2-3% to account for timing differences. If the P&L shows $850K in collections but the tax return reports $780K, the $70K gap needs an explanation.
Verify production-to-collection ratios. Pull production and collection reports from the practice management software and calculate the ratio: total collections ÷ total production. Healthy practices collect 98%+ of what they produce. If the practice shows 92-94% collection efficiency, that's a $60K-$80K annual revenue leak on a $1M practice.
The most definitive verification: request 12 months of bank statements and compare total deposits to reported collections. If the P&L shows $850K in collections but bank deposits total $780K, the $70K difference is either sitting in uncollected A/R or it never existed. Sellers resist providing bank statements because they reveal the truth—if they refuse, that's a walk-away signal.
Analyze Production by Procedure Code
Request production reports broken down by procedure code and analyze the distribution. A healthy practice generates revenue across a diversified mix—hygiene, restorative, endo, prosthetics, and preventive care. If 40% of annual production comes from crown-and-bridge work on 15 patients, you're buying a practice with embedded patient-retention risk.
Identify the top 10 patients by annual production and sum their contribution. If those 10 patients represent more than 15-20% of total revenue, the practice has a concentration problem. Losing two or three of those relationships post-transition could cut revenue by 5-10%.
Walk-Away Triggers
The seller refuses to document add-backs. If the add-back schedule includes $150K in "owner discretionary expenses" but the seller won't provide receipts, contracts, or line-item breakdowns, the number is fabricated.
Overhead ratios contradict profitability claims. If the seller claims $400K in SDE but the practice runs 72% overhead, the math doesn't work.
Collections can't be verified through bank statements. If reported collections exceed bank deposits by more than 5%, and the seller can't explain the gap with documented A/R aging and collection timelines, the revenue claim is inflated.
Financial trends show consistent decline. If collections, production, or profitability have declined year-over-year for two consecutive years, the practice is deteriorating. Understanding when to walk away from a deal protects you from overpaying for inflated claims that won't survive the first 90 days of ownership.
Sources & References
The data and claims in this article are drawn from the following sources. We prioritize government data, peer-reviewed research, and established industry publications to ensure accuracy.
- Preparing to Sell Your Dental Practice: A Complete Pre- ...— usdentalpractices.com
- EBITDA Normalization & Profitability Architecture— precisiondentalanalytics.comIndustry
- 4a. Key Performance Indicators (KPIs)— ada.orgIndustry
- Financial Due Diligence for Dental Practices: What to Look For in 2026— duckettladd.comIndustry
- What Every Dental Practice Buyer Needs to Review Before Closing— ameriprac.comIndustry
Frequently Asked Questions
Ready to verify practice profitability before buying?
Understanding true profitability is crucial when evaluating a dental practice acquisition. Minty Plus provides expert guidance to help you analyze financials accurately and identify red flags before making your investment.