Dental Practice Case Acceptance Rate Too Low: What to Do

Co-Founder, Minty Dental
In Summary
- Case acceptance rate measures the percentage of presented treatment value that patients agree to and schedule. The industry average sits between 34% and 46%, while top-performing practices reach 75% to 83%.
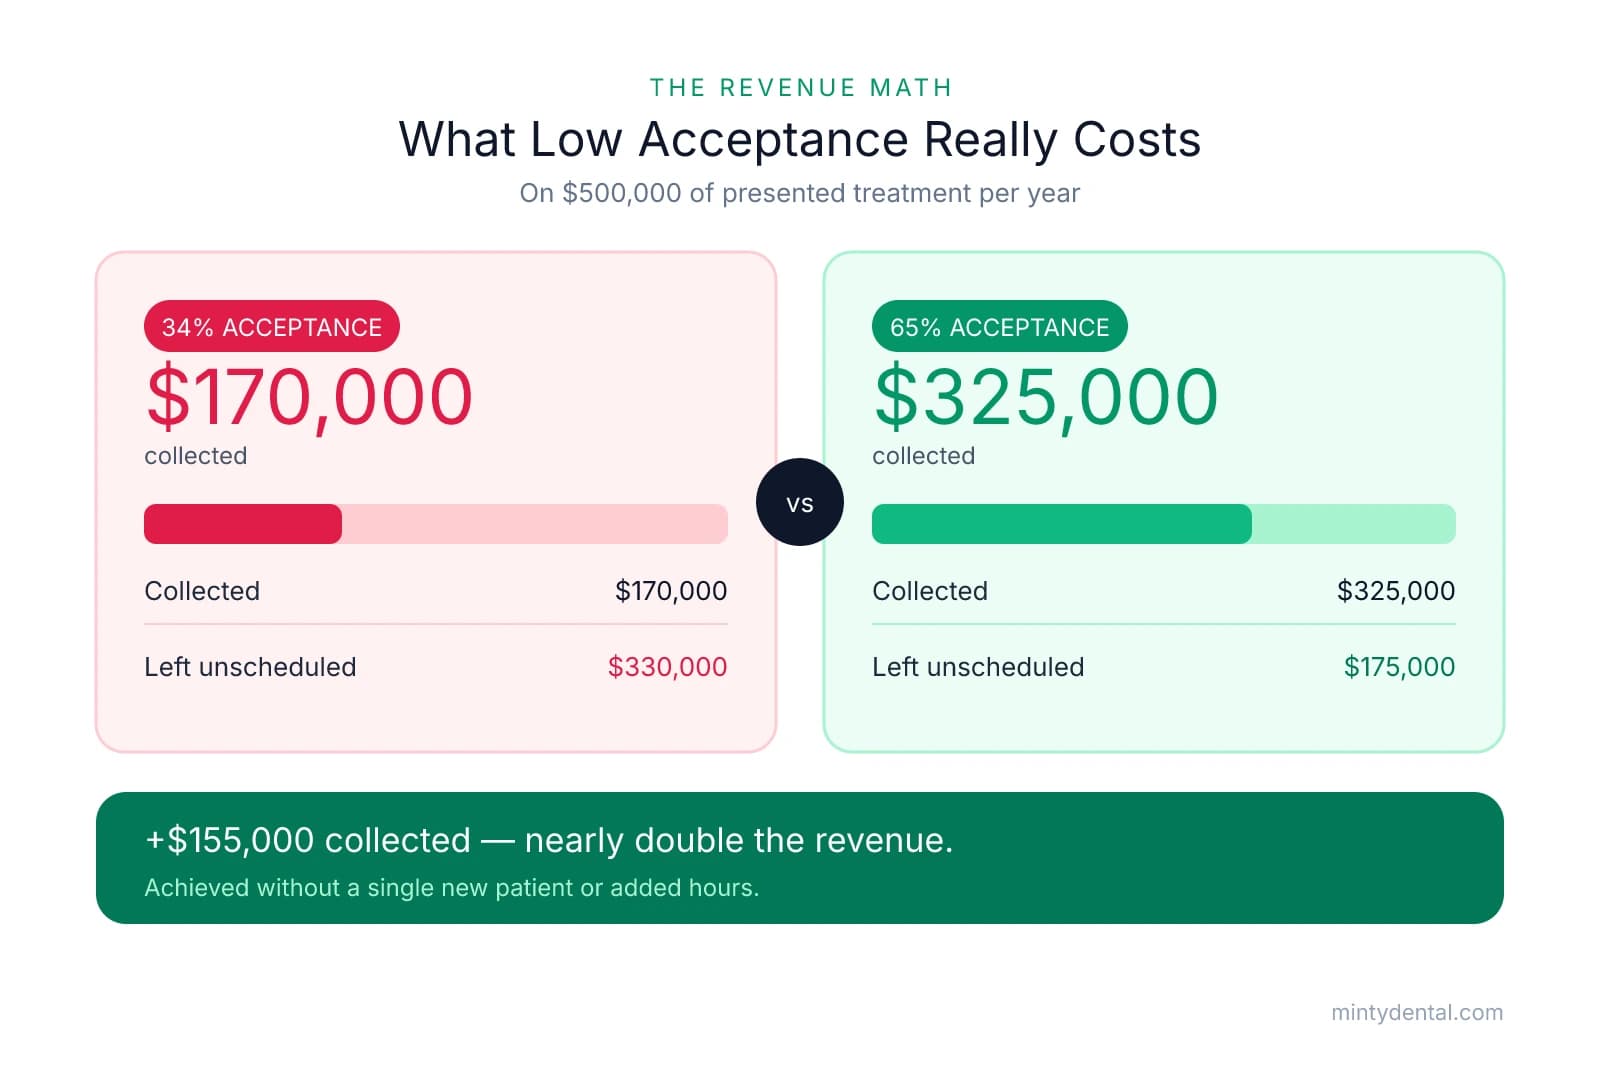
- A practice presenting $500,000 in annual treatment at a 34% acceptance rate collects roughly $170,000 and leaves $330,000 unscheduled. Reaching 65% acceptance more than doubles that collected figure without adding new patients.
- Comprehensive cases ($3,000 and above) close near 30%, while routine single-tooth procedures close near 80%. The mix of case types in your schedule significantly affects your overall rate.
- Many practices overestimate their acceptance rate by counting verbal agreement or a scheduled appointment rather than completed and paid treatment. Consistent definitions are required before the number is meaningful.
- A low acceptance rate is a symptom, not a root cause. Identifying which specific barrier is driving it determines which fixes will actually move the number.
Low Case Acceptance Costs More Than Most Owners Realize
Case acceptance rate is the percentage of presented treatment value that patients agree to and schedule. The formula is straightforward: divide the dollars of treatment accepted by the dollars of treatment presented, then multiply by 100. A practice that presents $200,000 in treatment over a quarter and schedules $90,000 of it has a 45% acceptance rate.
That number, on its own, tells you relatively little. What matters is where it sits relative to benchmarks and what it costs you in unscheduled revenue.
The benchmark gap is significant. According to Becker's Dental, the average U.S. dental practice accepts approximately 46% of presented treatment, while top-performing practices (the top 10%) reach 83%. Other industry data, including figures from Jarvis Analytics, places the average closer to 34% when measuring only completed and paid treatment rather than scheduled appointments. The spread between those two figures often reflects a measurement problem as much as a performance problem.
The revenue math is direct. A practice presenting $500,000 in annual treatment at a 34% acceptance rate collects $170,000 and leaves $330,000 unscheduled. Moving that rate to 65% produces $325,000 in collected treatment, nearly doubling the figure without adding a single new patient or expanding hours.
Case type also shapes the overall rate in ways that aggregate numbers can obscure. Routine single-tooth procedures close near 80%, while comprehensive cases starting around $3,000 close near 30%, per data cited by Overjet. A practice with a high volume of comprehensive treatment planning will naturally show a lower overall acceptance rate than one focused on single-unit restorative work, even if both teams are performing well. Knowing your case mix is a prerequisite for interpreting your rate accurately.
Measurement consistency matters just as much as the rate itself. Practices that count a verbal "yes" or a scheduled appointment as accepted treatment will consistently overestimate their performance. A more reliable definition counts treatment as accepted only when it is completed and paid, or at minimum when a deposit is collected and the appointment is confirmed. Aligning your team on this definition before pulling reports is a necessary first step, and it connects directly to how hygiene department productivity gets measured as well, since hygiene-driven diagnosis represents a significant share of presented treatment in most practices.
The acceptance rate is best understood as a diagnostic signal rather than a performance verdict. A low rate points to a problem somewhere in the patient journey, but it does not identify which problem. The sections that follow work through the most common barriers, starting with how to confirm your rate is actually low and then moving to the specific causes most likely to be driving it.
Diagnosing Which Barrier Is Driving Your Low Acceptance Rate
Before making changes to your presentation process, financial options, or scheduling systems, it is worth identifying which barrier is actually driving the pattern you are seeing. Applying a financial solution to an anxiety-driven problem, or restructuring scheduling for a practice where the real issue is communication, tends to produce limited results. The goal here is to segment your existing data before intervening.
The Academy of General Dentistry identifies five primary reasons patients reject treatment: fee sensitivity, competitive alternatives, past negative dental experiences (anxiety), scheduling friction, and communication gaps during case presentation. Each produces a recognizable pattern in practice management data, which means you can often identify the primary driver without guesswork.
Cost and affordability tend to show up as a sharp drop in acceptance above a specific dollar threshold, or as a meaningful gap between insured and uninsured patients. According to the CareQuest Institute for Oral Health, 27% of U.S. adults lack dental insurance, which means a significant portion of most patient panels faces a structural cost barrier regardless of how treatment is presented. If your acceptance rate on cases above $1,500 or $2,000 is substantially lower than on smaller cases, and that gap is wider for self-pay patients, cost is likely the primary driver.
Trust and communication gaps produce a different pattern. New-patient acceptance typically runs between 25% and 35%, while established-patient acceptance tends to fall in the 50% to 60% range. A gap at the lower end of that range is expected. A gap significantly wider than that, or a new-patient rate below 25%, often reflects a presentation or relationship-building problem rather than a financial one.
Anxiety and scheduling friction tend to appear in appointment data rather than acceptance data. If patients agree to treatment, schedule the appointment, and then cancel or no-show before restorative procedures, the barrier is more likely discomfort or logistical friction than cost or communication. Practices with elevated no-show rates on restorative appointments may find the diagnostic framework in this guide to high cancellation rates useful for separating anxiety-driven cancellations from scheduling system problems.
Competitive alternatives are harder to detect in internal data but often surface in patient exit feedback or when acceptance rates decline following a new practice opening nearby.
To identify which category applies to your practice, pull the following from your practice management system:
- Acceptance rate by case size (under $500, $500 to $1,500, $1,500 to $3,000, above $3,000)
- Acceptance rate by patient type (new vs. established)
- Acceptance rate by provider or treatment coordinator
- No-show and cancellation rate by appointment type (hygiene vs. restorative)
- Acceptance rate by insurance status (in-network, out-of-network, self-pay)
The pattern across these five cuts will typically point toward one or two primary categories. That diagnosis should drive which intervention you prioritize in the sections that follow.
The Two Highest-Leverage Fixes: Visual Communication and Financial Access
Once you have identified which barrier is driving your low acceptance rate, two interventions address the most common root causes across the widest range of practices: improving how treatment is shown to patients, and expanding how patients can pay for it. Cost and communication together account for the majority of declines in most practice settings, though they are not universal solutions.
Visual Communication: Making Pathology Self-Evident
Verbal-only case presentation asks patients to accept a problem they cannot see or feel. When a dentist describes a cracked margin or early-stage decay in clinical language, the patient is being asked to trust an abstract diagnosis. Annotated radiographs, chairside photography, and intraoral cameras shift that dynamic by making the clinical reality visible to both parties simultaneously.
According to a peer-reviewed study in Clinical, Cosmetic and Investigational Dentistry, intraoral camera use increases patient compliance and treatment acceptance by making pathology self-evident rather than abstract. Patients who can see the problem on a screen are no longer evaluating the dentist's word against their own skepticism; they are evaluating a shared clinical image.
Practical implementation does not require a complete technology overhaul. Intraoral photography during the hygiene exam, annotated radiographs displayed chairside, and before-and-after images for restorative cases are sufficient starting points for most practices.
Financial Access: Framing Cost as a Monthly Decision
Cost is the most commonly cited barrier to dental care, and the way it is presented affects how patients evaluate it. Presenting a monthly payment figure alongside the total case fee, rather than the total alone, changes the reference point patients use to assess affordability. A $3,600 crown and bridge case framed as "$150 per month for 24 months" is evaluated differently than the same case presented as a lump sum.
Two structural tools extend this further:
- Proactive financing presentation. Offering financing options before the patient raises cost concerns tends to produce better outcomes than introducing them after a decline. Reactive offers can feel like a negotiation; proactive offers frame payment flexibility as a standard part of the practice's care model.
- Treatment phasing across insurance benefit years. For large cases, scheduling treatment across two calendar years allows patients to apply two separate annual maximums, reducing out-of-pocket cost without reducing total practice revenue.
When These Two Levers Are Not Enough
| Lever | Barrier Addressed | Implementation Step |
|---|---|---|
| Visual communication tools | Communication gap, low trust | Add intraoral photography to hygiene exam workflow |
| Monthly payment framing | Cost sensitivity, sticker shock | Present payment options proactively at case presentation |
| Treatment phasing | Large-case affordability | Schedule across benefit years for cases above $2,000 |
| Consequence-based presentation | Time-driven deferral | Explain clinical progression if treatment is delayed |
Anxiety-driven declines require a different response than cost or communication barriers. Patients who agree to treatment and then cancel before restorative appointments are more likely responding to procedural fear than to cost. For those patients, sedation options, appointment structure changes, or a longer relationship-building period before presenting comprehensive treatment tend to be more effective than financial tools alone.
A 30-Day Action Plan for Practice Owners
The sections above cover how to measure your rate accurately, identify which barrier is driving it, and match the right intervention to the right problem. This final section sequences those steps into a concrete plan you can begin this week.
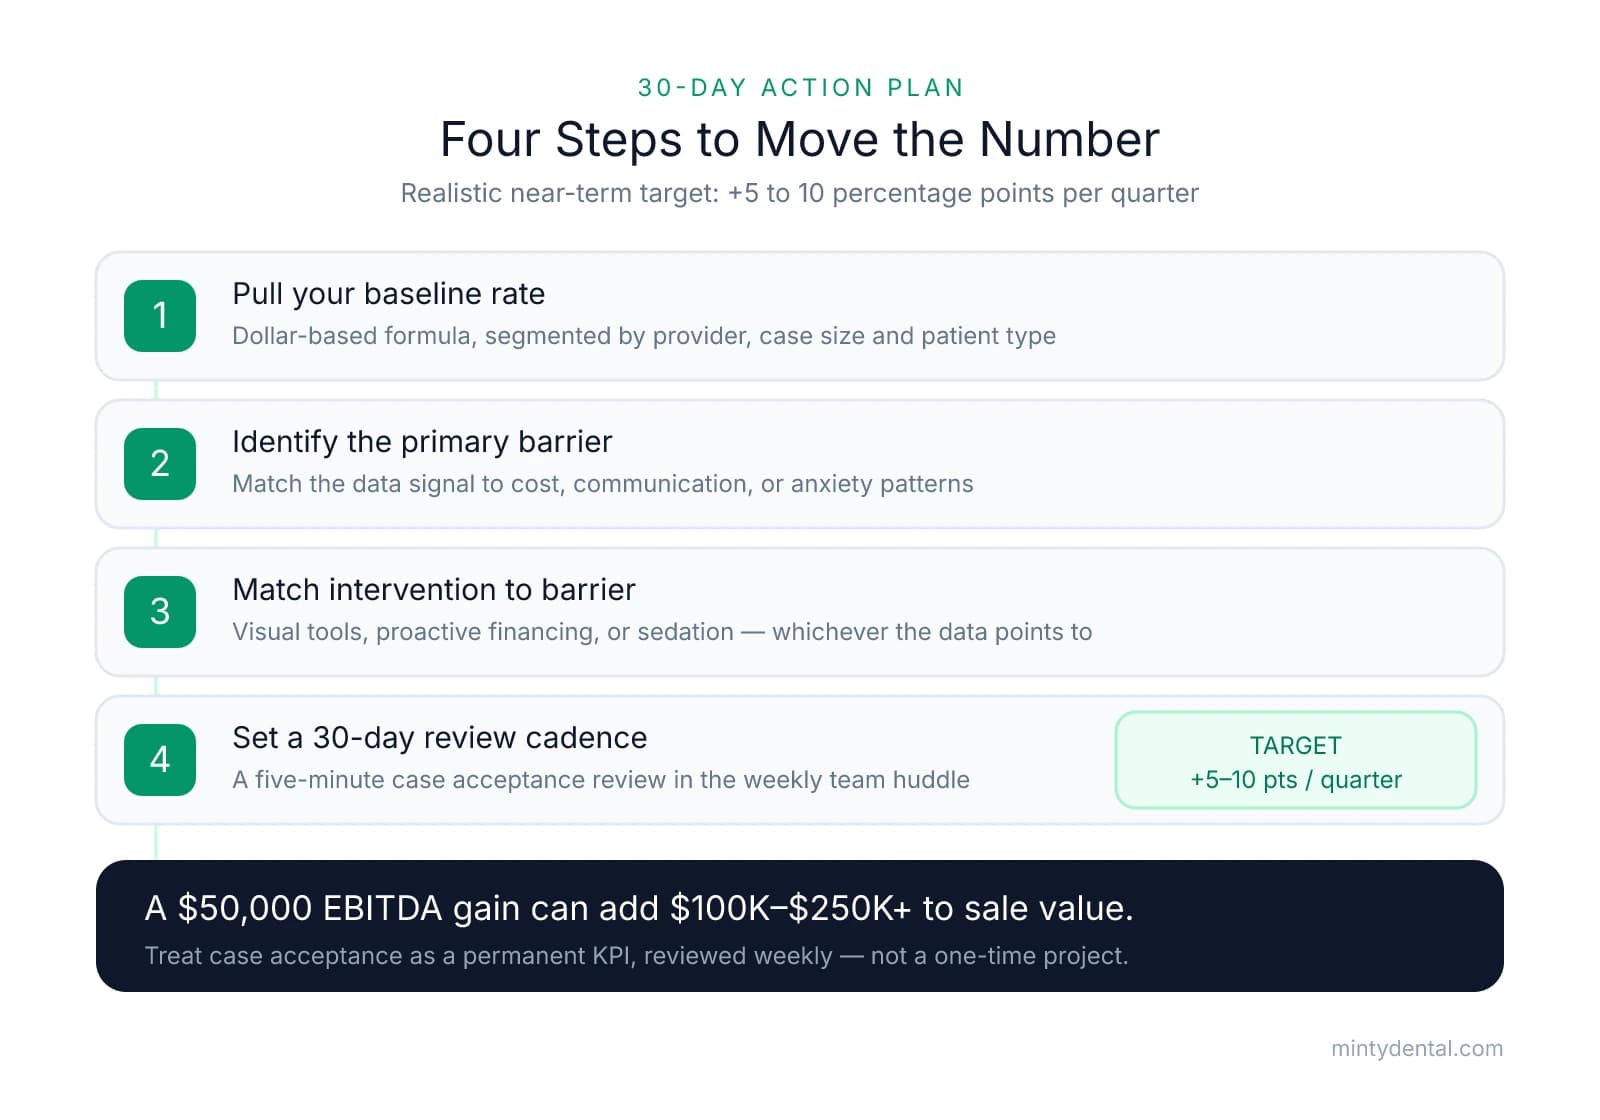
Step 1: Pull your baseline rate from the practice management system. Use the dollar-based formula (treatment accepted divided by treatment presented, multiplied by 100) and segment the output by provider, procedure type, case size, and new versus established patients. This segmented view is what allows you to distinguish a communication problem from a cost problem from an anxiety pattern. A single aggregate number is not sufficient for diagnosis.
Step 2: Identify the primary barrier pattern using the diagnostic questions from Section 2. Look for the signal that points to one category: a sharp drop in acceptance above a dollar threshold suggests cost sensitivity; a wide gap between new and established patient rates suggests a trust or presentation problem; elevated no-show rates on restorative appointments suggest anxiety or scheduling friction. Most practices will find one pattern that accounts for the majority of their gap.
Step 3: Match the intervention to the identified barrier. If the data points to a communication gap, add intraoral photography to the hygiene exam workflow and annotate radiographs chairside before presenting treatment. If cost is the primary driver, introduce proactive financing presentation and consider phasing large cases across benefit years. If anxiety or scheduling friction is the issue, evaluate sedation options and appointment structure before adjusting your financial tools.
Step 4: Set a 30-day review cadence and define what improvement looks like. A gain of 5 to 10 percentage points in the first quarter is a realistic near-term target for most practices making focused changes. Building a five-minute case acceptance review into your weekly huddle keeps the number visible to the team rather than surfacing only at quarterly reviews.
Beyond the operational benefit, sustained improvement in case acceptance has a direct effect on practice value. Higher acceptance increases production and collections without adding overhead, which flows directly to owner income and EBITDA. A $50,000 gain in annual EBITDA, achieved through improved acceptance rather than new patient volume or additional staff, can add $100,000 to $250,000 or more to your practice's sale value at typical dental multiples. Owners who want to understand how this connects to broader valuation strategy can find a detailed breakdown in this guide to increasing practice value before a sale.
Case acceptance is most valuable when treated as a permanent key performance indicator reviewed weekly, not a one-time improvement project. When patients delay treatment, they are often unsure, overwhelmed, worried about cost, or missing a clear next step, which is why measurement and coaching need to stay embedded in the operating rhythm. The practices that sustain high acceptance rates over time are the ones that have built that rhythm into their culture.
Sources & References
The data and claims in this article are drawn from the following sources. We prioritize government data, peer-reviewed research, and established industry publications to ensure accuracy.
- How dental practices fare in case acceptance, collection rates and more— beckersdental.comNews
- Large Treatment Plan Acceptance Strategies for Dentists - Overjet— overjet.comIndustry
- Five Reasons Why Patients Reject Treatment (And What to Do About It)— agd.orgIndustry
- New Report: 72 Million Adults in the US Lack Dental Insurance, Nearly ...— carequest.orgIndustry
- Clinical applications of intraoral camera to increase patient ... - PMC— pmc.ncbi.nlm.nih.govGovernment
- How to Improve Case Acceptance in Your Dental Practice - Dentrix Ascend— www.dentrixascend.com
Ready to boost your case acceptance rates?
Low case acceptance often stems from operational inefficiencies in how treatment plans are presented and managed. Minty's Operations service handles the business side of your practice, including patient communication systems and treatment plan workflows that drive higher acceptance rates.