How to Increase Dental Practice Value Before Selling

Co-Founder, Minty Dental

In Summary
- Dental practices sell for 5x to 8x adjusted EBITDA for solo and small practices, meaning overhead structure directly determines sale price, not gross collections alone
- Two practices collecting $1 million annually can sell for hundreds of thousands of dollars apart if their overhead percentages differ by even 7 to 10 percentage points
- Buyers and lenders evaluate three dimensions: earnings quality, owner dependence, and transferable goodwill
- Practices with overhead consistently above 70% face financing challenges because lenders underwrite on the same cash flow buyers do
- The preparation window matters: lenders and buyers review 2 to 3 years of financial history, so improvements made in the final months before listing often arrive too late to affect the numbers that drive the offer
Buyers Price Risk and Earnings Quality, Not Just Revenue
Two practices collecting the same gross revenue can sell for dramatically different prices. The difference is almost always earnings quality, not revenue level.
Most dental practice valuations are still described in terms of a percentage of collections, but that framing does not reflect how buyers and lenders actually underwrite a deal. Modern buyers, including individual dentists and DSOs alike, apply a multiple to adjusted EBITDA (earnings before interest, taxes, depreciation, and amortization, normalized for owner compensation and one-time expenses). According to Ad Astra Equity's 2026 dental valuation analysis, solo and small practices typically sell for 5x to 8x adjusted EBITDA, with larger associate-led groups clearing 7x to 9x and DSO platform-grade practices reaching 10x to 12x or higher.
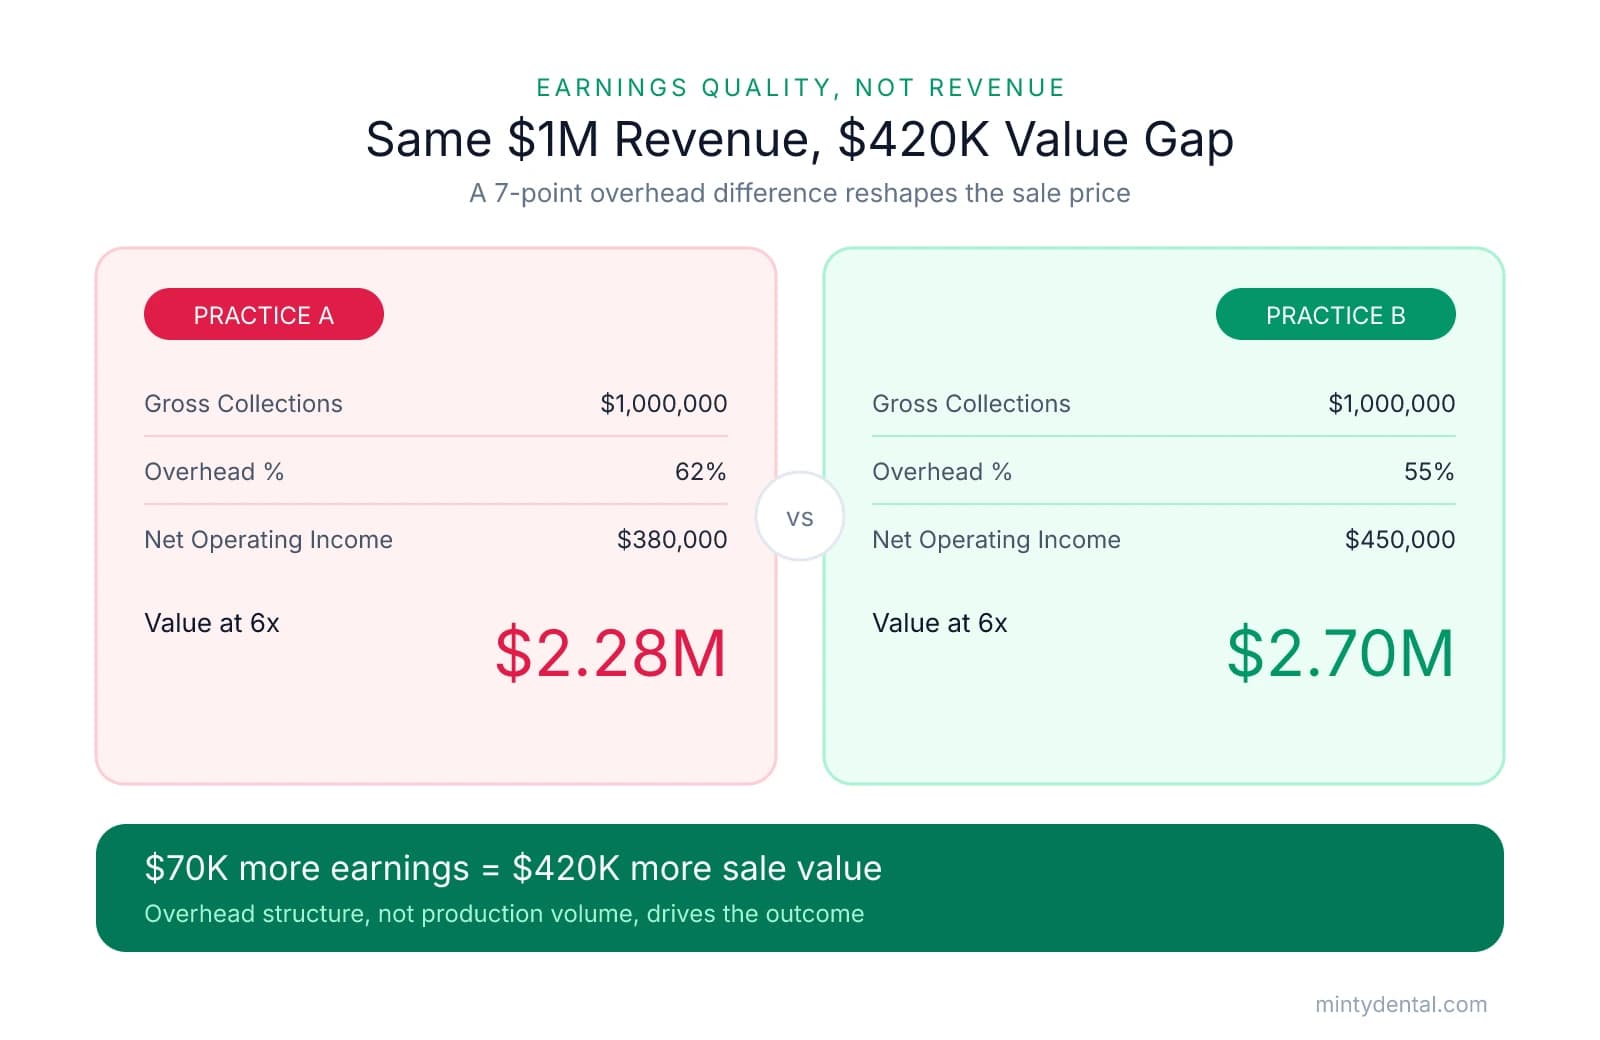
The practical consequence is that overhead percentage becomes a direct multiplier on sale price. Consider two practices, each collecting $1 million annually:
| Metric | Practice A | Practice B |
|---|---|---|
| Gross Collections | $1,000,000 | $1,000,000 |
| Overhead % | 62% | 55% |
| Net Operating Income | $380,000 | $450,000 |
| Estimated Value at 6x EBITDA | $2,280,000 | $2,700,000 |
The $70,000 difference in annual earnings produces a $420,000 gap in estimated value at the same multiple. Overhead structure, not production volume, drives that outcome.
Buyers evaluate practices across three dimensions when assessing whether a multiple is justified:
- Earnings quality: Is net income consistent across two to three years, or does it fluctuate with one-time events, deferred expenses, or aggressive add-backs? Lenders reviewing a practice P&L will normalize the financials and underwrite on the result, not the headline number.
- Owner dependence: Practices where the owner performs 90% or more of production carry meaningful key-provider risk. Per Ad Astra Equity, this concentration can reduce valuation by 10 to 20%.
- Transferable goodwill: What portion of patient relationships, referral patterns, and production capacity will survive the ownership transition? Goodwill tied entirely to the selling doctor's personal relationships is harder for buyers to underwrite with confidence.
Practices with overhead consistently above 70% face an additional constraint: lenders underwrite on the same cash flow buyers do, and thin margins reduce the debt service coverage that makes financing viable. Because buyers and lenders look at two to three years of financial history, improvements made in the final months before listing may not be reflected in the numbers that actually drive the offer. Owners who begin reducing overhead, building associate capacity, and documenting earnings consistency well before listing give buyers a track record to underwrite, not a projection to accept on faith.
Improving the Financial Metrics Buyers Scrutinize Most
Because buyers apply a multiple to adjusted EBITDA rather than to gross collections, every dollar of overhead reduction compounds into a larger change in sale price. A 5-percentage-point reduction in overhead on a $1 million practice adds roughly $50,000 to annual earnings, which at a 6x multiple translates to approximately $300,000 in additional sale price. The three levers below are where most practices have the most identifiable room to improve.
1. Benchmark Overhead by Category
Overhead reduction is more tractable when broken down by category rather than treated as a single number. According to DentiMax's 2026 dental overhead report, industry benchmarks by expense category are:
| Category | Industry Average | Warning Threshold |
|---|---|---|
| Personnel/Staff | 24-26% of collections | Above 30% |
| Clinical Supplies | 5-8% | Above 9% |
| Lab Fees | 6-8% | Above 10% |
| Facility Costs | 7-10% | Above 12% |
Pulling three years of P&L statements and mapping each category against these benchmarks will surface where the practice is above the norm. Personnel costs are the largest single line item and the most common source of excess, often because staffing levels were set during a growth phase and never adjusted. Clinical supplies and lab fees frequently run high due to inconsistent vendor pricing or ordering habits rather than clinical necessity.
2. Improve Collections Rate
The ADA recommends collecting 100% net-to-net, meaning the practice should collect every dollar of net production after contractual write-offs and insurance adjustments. Practices that consistently collect below 97% of net production are giving away revenue the clinical team already earned.
The most common causes are collecting patient balances after the fact rather than at the time of service, and delayed or incomplete insurance verification before appointments. Both are systems problems, not clinical ones, and both are correctable before a sale. A practice producing $1 million gross with a 94% collection rate is leaving roughly $27,000 to $30,000 in annual revenue uncollected, which buyers will identify and price into their offer.
3. Review and Update Fee Schedules
Fee schedules that haven't been reviewed in two or more years are likely below local market rates. A systematic comparison against UCR data and regional benchmarks can improve net production without adding patients or clinical hours, and the effect on earnings is immediate rather than gradual.
4. Clean Up the Financials
Buyers and their lenders will conduct a quality-of-earnings review that normalizes the P&L for personal expenses run through the business. These add-backs are legitimate when properly documented, but undocumented or inconsistently categorized personal expenses create friction during due diligence and can cause lenders to disallow them entirely. A detailed guide to which add-backs lenders actually accept is worth reviewing before preparing financials for market.
The goal is three consecutive years of clean, consistent records where every add-back is clearly labeled, categorized, and supportable. Buyers can underwrite a track record; they cannot underwrite a promise that next year's numbers will look different.
Reducing Owner Dependence and Strengthening Transferable Goodwill
Goodwill represents 60% to 80% of a typical dental practice purchase price, per US Dental Practices, but not all goodwill transfers equally. Practice goodwill, tied to systems, staff, brand, and patient relationships embedded in the business, transfers reliably to a new owner. Personal goodwill, tied to the selling doctor's clinical reputation and individual patient relationships, is harder to underwrite because there is no guarantee it survives the transition. Sellers who shift the composition of their goodwill toward the practice side before listing give buyers a more defensible asset to finance.
Owner Dependence Is the Heaviest Risk Factor in Buyer Underwriting
Practices where the owner produces 90% or more of revenue face an estimated 10 to 20% valuation reduction because buyers price key-provider risk into the multiple. According to TUSK Practice Sales, owner dependence is one of the heaviest weights on the risk side of buyer evaluation, because a practice that runs on one person's clinical production does not function the same way after that person leaves.
Four actions address this directly:
1. Build associate production. Even modest associate contribution reduces revenue concentration. A practice where an associate generates 20 to 30% of collections is structurally different from a solo-provider model, because the buyer can see that production capacity is not entirely tied to the departing owner. Owners considering how to reduce their clinical hours before listing should plan associate onboarding early enough that the associate's production appears in at least two years of financial history.
2. Strengthen the hygiene department. Hygiene revenue above 30% of collections is associated with premium multiples because it represents recurring, predictable revenue that does not depend on the owner's clinical schedule. A strong recall system, consistent recare percentages, and a fully scheduled hygiene column signal to buyers that a meaningful share of revenue will continue regardless of who owns the practice.
3. Retain key staff. Tenured hygienists, office managers, and assistants are a direct signal of operational stability during due diligence. High turnover raises concerns about culture and continuity, and buyers recognize that staff departures after closing often accelerate patient attrition. As PPS Practice Sales notes, a stable workforce lowers perceived risk and supports a stronger valuation multiple.
4. Document clinical and administrative systems. Scheduling protocols, recall workflows, treatment planning processes, and financial reporting procedures should exist in written form that a new owner or manager can follow without institutional knowledge from the seller. When the practice runs on documented systems rather than the owner's presence, buyers can evaluate operational continuity with more confidence.
New Patient Flow as a Goodwill Metric
Practices lose approximately 15% of their active patient base each year through attrition. For a 1,000-patient practice, that means maintaining 12 to 13 new patients per month just to hold the active count steady. Buyers evaluate new patient flow as a forward-looking indicator of practice health, because a declining trend suggests goodwill is eroding even if current collections look stable. Tracking and documenting new patient volume consistently in the years before listing gives buyers a stable or growing trend rather than a number asserted without history.
A Sequenced 2-3 Year Improvement Plan
The improvements covered above, including overhead benchmarking, collections rate, associate production, and staff retention, are most effective when sequenced deliberately. Because buyers and lenders review two to three years of financial history, changes made in the final six months before listing often arrive too late to influence the numbers that determine the offer.
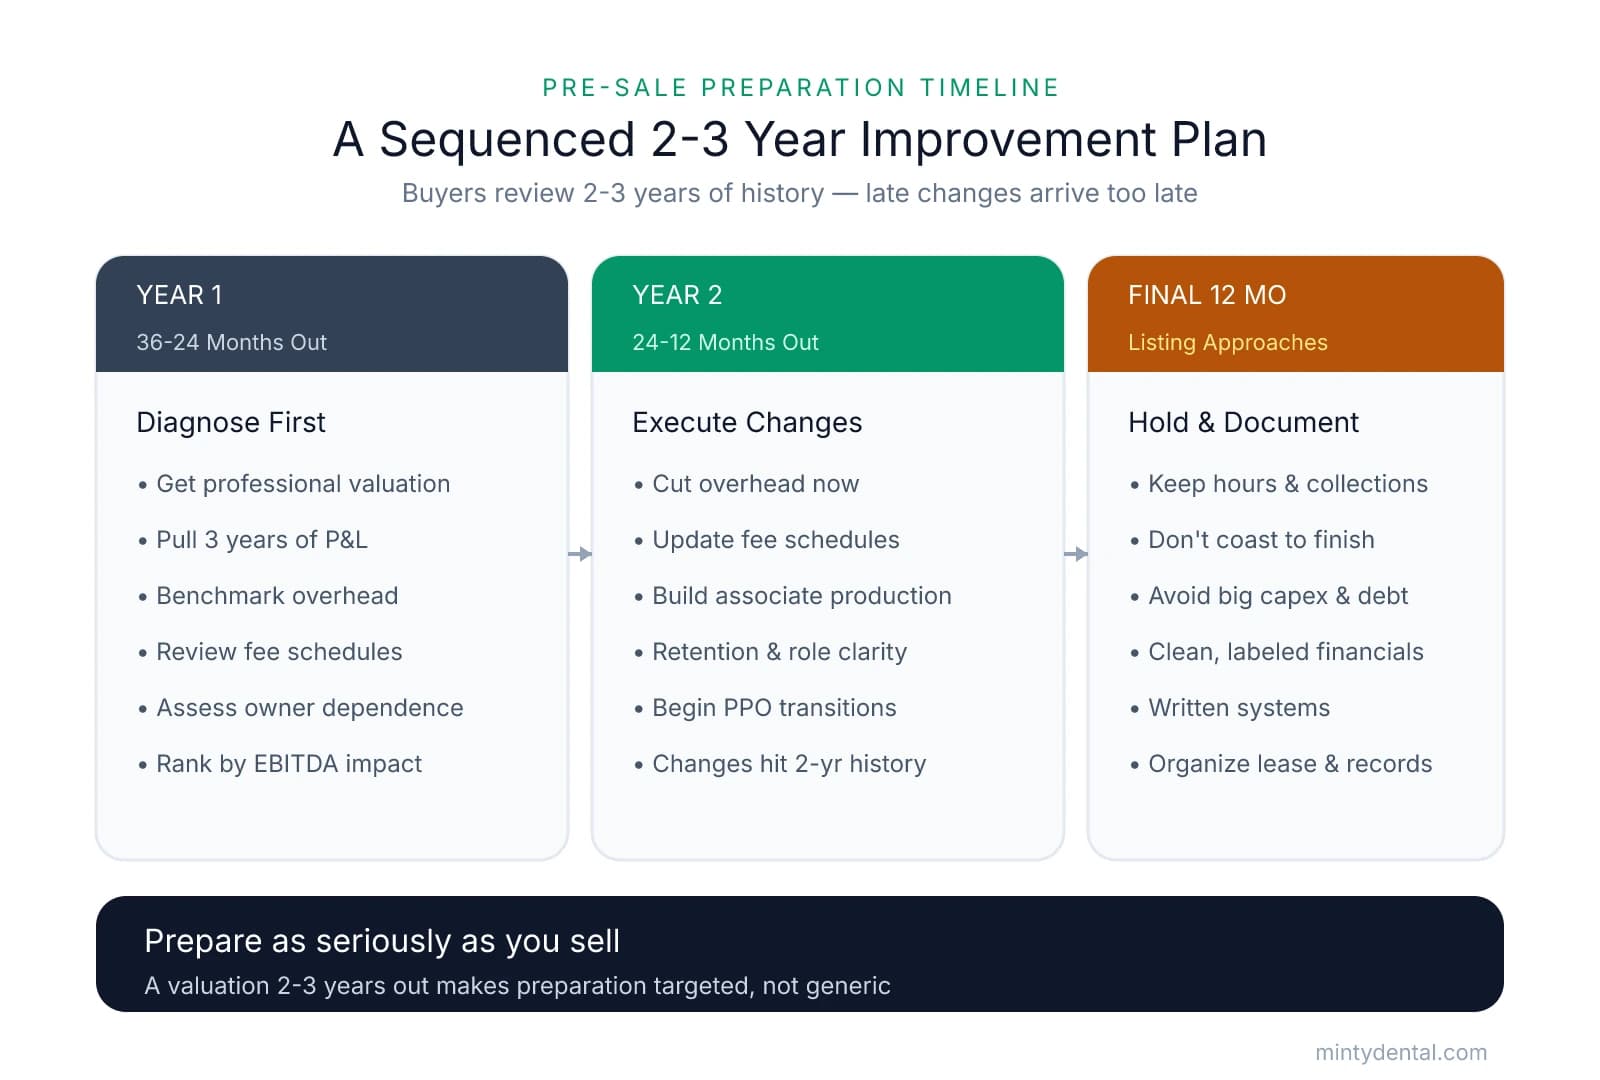
Year 1 (36 to 24 Months Out): Diagnose Before You Build
The first year is a diagnostic phase. The most useful action at this stage is obtaining a professional valuation, not as a pre-listing formality, but as a tool for identifying which specific gaps will have the most impact on the final sale price. A valuation at this stage reveals whether the practice's primary constraint is overhead structure, owner dependence, earnings consistency, or some combination of the three.
Alongside the valuation, pull three years of P&L statements and benchmark overhead by category against industry norms, review fee schedules for gaps relative to local UCR data, and assess what percentage of production flows through you versus associates or hygiene. These inputs give you a prioritized list of improvements ranked by their likely effect on adjusted EBITDA.
Year 2 (24 to 12 Months Out): Execute the Highest-Impact Changes
With a clear diagnostic picture, Year 2 is the time to act. Overhead reductions made here will appear in two years of financial history by the time the practice lists. Fee schedule updates made now will compound into the collections trend buyers evaluate. If owner dependence is high, this is the window to begin building associate production, because associate contribution needs to appear in at least two years of financials to carry weight with buyers.
Staff retention efforts, including compensation reviews and role clarity, also belong in this phase. If PPO participation is suppressing net production, the process of dropping lower-reimbursing plans takes time to execute without disrupting patient flow, making Year 2 the appropriate window to begin that transition.
Final 12 Months: Maintain Momentum and Prepare Documentation
The most common mistake in this phase is reducing clinical hours or days to ease toward retirement. As Menlo Transitions notes, coasting to the finish line directly suppresses the collections trend buyers underwrite. Maintaining or modestly growing collections through the final year protects the revenue trajectory that justifies the multiple.
Large capital expenditures are worth avoiding in this window. Equipment purchases made in the final 12 months are rarely recouped in the sale price, and new debt can complicate the practice's financial picture during due diligence.
This phase is also when documentation becomes the priority: clean, labeled financials with supported add-backs, written clinical and administrative systems, and organized lease and staff records. According to US Dental Practices, dentists who treat the preparation phase as seriously as the sale itself consistently achieve better outcomes than those who list reactively. A professional valuation obtained two to three years before listing is what makes that preparation targeted rather than generic.
Sources & References
The data and claims in this article are drawn from the following sources. We prioritize government data, peer-reviewed research, and established industry publications to ensure accuracy.
- Dental Practice Valuation & EBITDA Multiples (2026) - Ad Astra Equity— adastraequity.comIndustry
- Dental Office Overhead Percentages: 2026 Report - DentiMax— dentimax.comIndustry
- Buying or Selling a Dental Practice, Start with an Accurate Valuation— ada.orgIndustry
- Dental Practice Goodwill: How It's Valued and Why It Matters— www.usdentalpractices.comIndustry
- One Doctor, All the Risk: What Owner Dependence Really Costs at Exit— tuskpracticesales.comIndustry
- How Team Retention Impacts Practice Valuation— ppssellsdds.comIndustry
- Key Metrics to Improve Before Selling Your Dental Practice— www.menlotransitions.comIndustry
- Dental Practice Goodwill: How It's Valued and Why It Matters— usdentalpractices.comIndustry
Ready to maximize your practice's sale price?
Increasing your practice's value requires strategic planning and operational excellence. Minty's team helps dental practice owners optimize their businesses for successful exits, from financial restructuring to operational improvements that buyers actively seek.