Is Your Dental Hygiene Department Actually Profitable?

Co-Founder, Minty Dental

In Summary
- Most practices track hygiene gross production, but gross production overstates actual revenue because PPO write-offs typically reduce billed fees by 30 to 45%, meaning a hygienist billing $1,400 per day may collect only $800 to $980.
- The full cost of a hygienist extends beyond the hourly wage: benefits, payroll taxes, and employer-side costs add roughly 20 to 25% above base pay, making total daily compensation meaningfully higher than the wage alone suggests.
- The industry's baseline profitability test is the 3:1 ratio: net collectible hygiene production should be at least three times total hygiene compensation.
- A fully booked hygienist running prophylaxis-only appointments at PPO rates can still fall below the 3:1 threshold, making schedule fullness an unreliable proxy for department profitability.
- Calculating true hygiene profitability requires shifting the question from "how much does hygiene produce?" to "how much does hygiene collect, and what does it cost to deliver that?"
Gross Production Is Not the Same as Hygiene Profit
Hygiene profitability is the difference between what a hygiene department actually collects, after insurance adjustments and write-offs, and what it costs to deliver that care, including wages, benefits, supplies, and a proportional share of facility and administrative overhead. It is a different number from gross production, and in heavily contracted practices, it can be a dramatically smaller one.
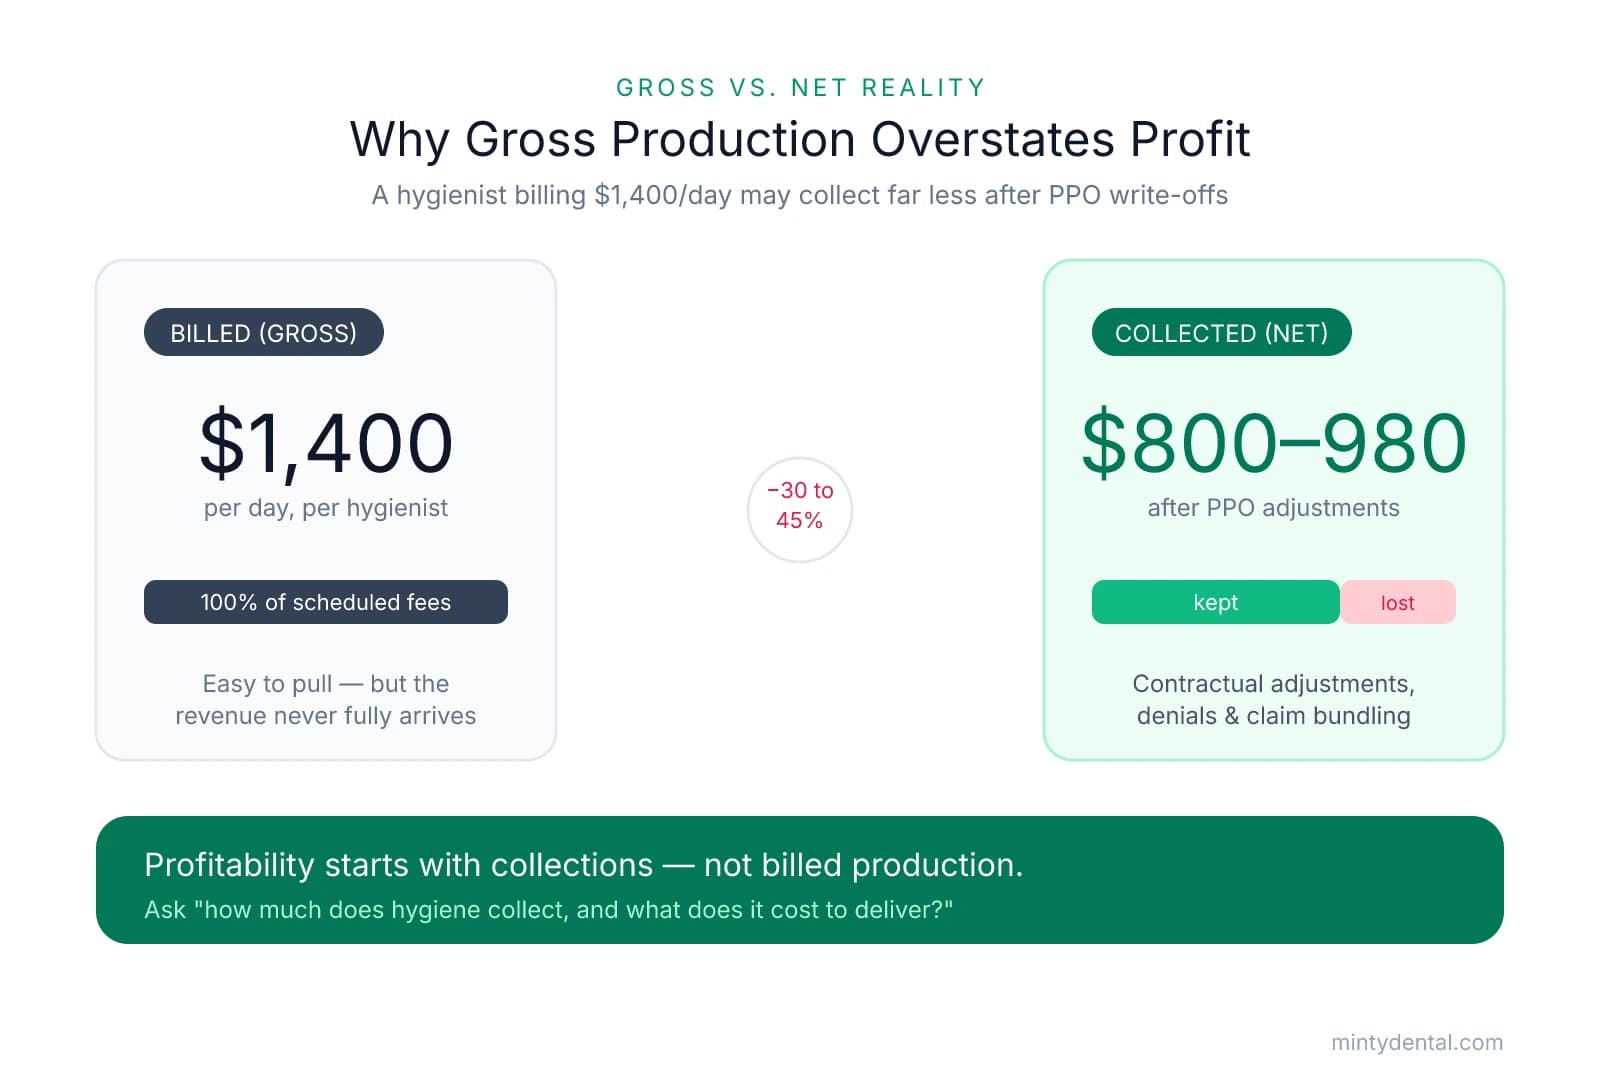
Most practice owners evaluate their hygiene department by looking at scheduled production or gross billed fees. Those numbers are visible, easy to pull from a practice management report, and satisfying when they trend upward. The problem is that gross production does not account for the revenue that never arrives. In practices with significant PPO participation, collection losses of 30 to 45% of billed production are common once contractual adjustments, administrative denials, and claim bundling are factored in. A hygienist billing $1,400 per day may generate net collections of only $800 to $980 after those adjustments, which changes the profitability picture considerably.
The cost side of the equation is similarly underestimated. According to Dimensions of Dental Hygiene, the average hourly wage for a dental hygienist reached $48.85 in 2025. At that rate, an eight-hour day generates $390 in base wages before any employer-side costs. Adding benefits, payroll taxes, and other employer contributions, which typically run 20 to 25% above the base hourly rate, brings total daily compensation to roughly $490 to $520. That figure is the floor of what the department must recover before it contributes anything to practice overhead or profit.
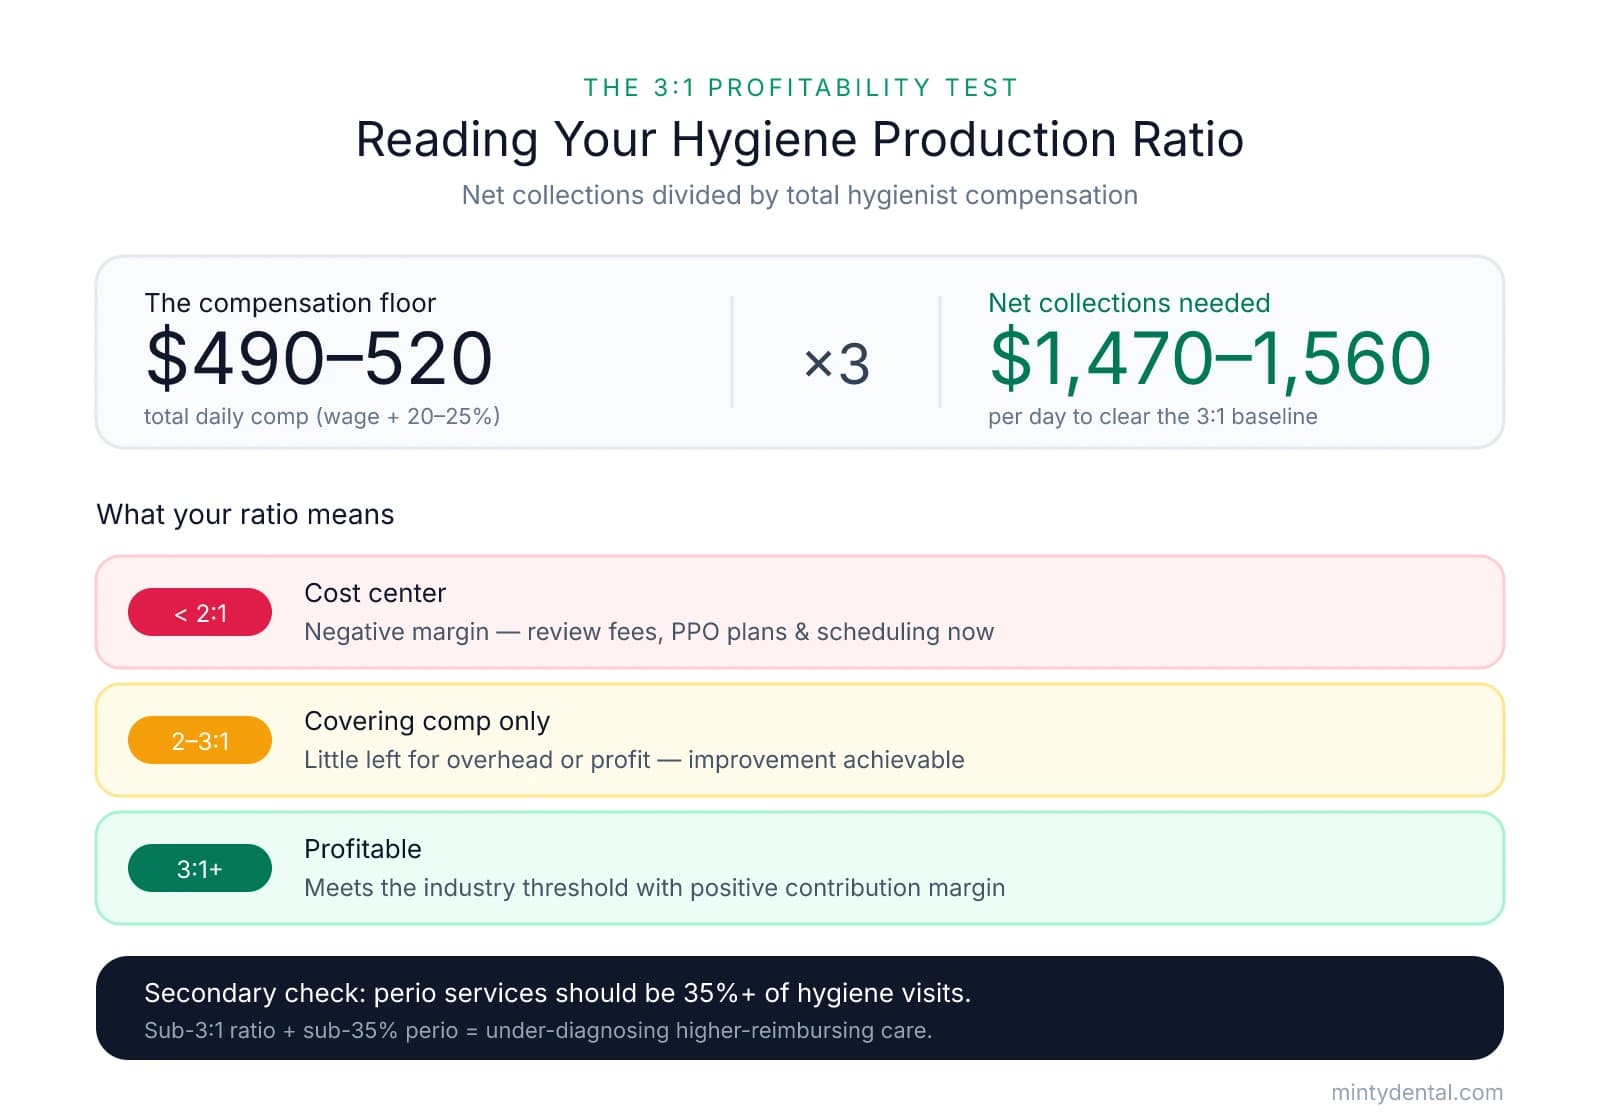
The industry's standard for evaluating whether a hygiene department clears that floor is the 3:1 ratio: net collectible hygiene production should be at least three times total hygiene compensation. Rachel Wall, founder of Inspired Hygiene and one of the field's most widely cited consultants, identifies this ratio as the first threshold of departmental profitability. Applied to the compensation figures above, a hygienist costing $490 to $520 per day in total compensation needs to generate $1,470 to $1,560 in net daily collections to meet that baseline.
Schedule fullness does not guarantee that threshold is met. A hygienist booked solidly with prophylaxis appointments at PPO-contracted rates may bill $1,400 per day and collect $900, producing a ratio closer to 1.7:1. The schedule looks productive; the department is not profitable by the 3:1 standard. Owners who focus on utilization rates or gross production numbers can miss a profitability problem that has been present for years.
The sections that follow work through each component of the profitability calculation in detail, starting with the audit itself. Buyers evaluating a practice during due diligence face the same calculation, since a rebuilt or underperforming hygiene department affects both current cash flow and longer-term practice value.
How to Run a Hygiene Profitability Audit in Your Own Practice
The data you need for this audit already exists in your practice management software. The five steps below translate that data into a hygiene contribution margin, which is the number that tells you whether your department is generating profit or consuming it.
Step 1: Pull net hygiene collections for the trailing 12 months. Run a collections report filtered to hygiene procedure codes, covering the past 12 months. Use the post-adjustment, post-write-off figure, not gross production. This is the amount that actually reached your bank account from hygiene services. In practices with significant PPO participation, this number is often 30 to 45% below gross billed production, so the gap between the two figures is itself diagnostic.
Step 2: Calculate total hygiene compensation. Add base wages for all hygienists, then apply employer-side payroll taxes. The employer FICA contribution runs 7.65% of gross wages, per the IRS employer tax guide. Add any benefits the practice provides, including health insurance, retirement contributions, and paid time off. According to the Bureau of Labor Statistics, the 2025 median hygienist pay sits at $98,100 annually, and total compensation with benefits typically runs 20 to 25% above base wages.
Step 3: Identify direct hygiene costs. Clinical supplies attributable to hygiene, including prophy paste, fluoride, sealant materials, and disposables, typically run 3 to 5% of hygiene collections, per DentiMax's 2026 overhead benchmarks. Add any hygiene-specific equipment costs, such as instrument sharpening, ultrasonic maintenance, or digital radiography expenses allocated to hygiene operatories.
Step 4: Allocate a proportional share of facility and administrative overhead. A straightforward method is to apply your practice's overall overhead percentage to hygiene collections, then subtract hygienist compensation, since that is already counted in Step 2. This avoids double-counting while ensuring the department carries its share of rent, utilities, front-desk labor, and software costs. Owners who want a deeper look at how overhead categories break down can use the framework in this guide to dental practice overhead.
Step 5: Calculate the hygiene contribution margin. Subtract total hygiene costs (Steps 2 through 4) from net hygiene collections (Step 1). Then divide net collections by total hygienist compensation to calculate your production ratio.
What the results mean:
- Ratio of 3:1 or higher, positive contribution margin: The department is profitable by the standard industry threshold.
- Ratio between 2:1 and 3:1: The department is covering compensation but contributing little to overhead or practice profit. Improvement is achievable with targeted changes.
- Ratio below 2:1 or negative contribution margin: The department is operating as a cost center. This warrants immediate review of fee schedules, PPO participation, and scheduling structure.
Secondary diagnostic: perio services percentage. Once you have the margin calculation, run a procedure mix report and calculate what percentage of hygiene visits involved periodontal treatment, including scaling and root planing and perio maintenance, versus prophylaxis. Inspired Hygiene's consultants recommend a target of 35% or more. A perio percentage below 35% combined with a sub-3:1 production ratio is a strong signal that the department is under-diagnosing and under-coding, leaving higher-reimbursing services on the table. The two metrics together tell you whether the problem is cost structure, revenue mix, or both.
The Indirect Revenue Hygiene Generates — and Why It Still Matters
The 3:1 ratio and contribution margin calculation measure what hygiene collects directly. They do not capture what hygiene enables elsewhere in the practice, and for many owners, that gap is significant enough to change how they interpret a below-threshold result.
Hygiene appointments are the primary point of contact where restorative needs are identified. According to MyBCAT's analysis of hygiene valuation drivers, approximately 20% of hygiene exams result in restorative treatment, and the total visit value, combining direct hygiene production with the doctor exam and same-day treatment acceptance, reaches $350 to $450 in high-performing practices. In practices without structured recall and case presentation systems, that same visit generates $175 to $220. The difference is not the hygienist's production; it is whether the practice has systems in place to identify, present, and schedule the downstream care that hygiene appointments surface.
Tracking same-day treatment acceptance from hygiene is the metric that makes this indirect contribution visible. To calculate it, pull all restorative treatment scheduled or completed on the same day as a hygiene appointment over a rolling 90-day period, then divide by total hygiene visits in that window. A rate below 10% often signals that case presentation is inconsistent or that the doctor exam is too brief to surface actionable findings. Practices with structured co-diagnosis protocols, where the hygienist and doctor discuss findings with the patient together, tend to see meaningfully higher acceptance rates.
This context matters when interpreting a hygiene department running slightly below the 3:1 threshold. If that department is generating strong same-day treatment acceptance and feeding a healthy restorative schedule, the indirect revenue contribution may more than compensate for the direct profitability gap. Reducing hygiene capacity in that scenario would likely reduce restorative production as well.
That said, indirect value should not become a reason to avoid fixing direct profitability problems. A department that falls below the 3:1 threshold and produces low same-day treatment acceptance has neither direct nor indirect profitability working in its favor, and that combination warrants the structural review the previous section outlined.
Hygiene recall rates carry a third dimension that owners planning an eventual exit should weigh carefully. Practices with reappointment rates at or above 85% generate predictable, recurring revenue that buyers and appraisers price positively, because that consistency reduces the revenue risk a buyer is taking on. Owners focused on increasing practice value before selling will find that recall rate improvement is one of the few operational changes that affects both current cash flow and the practice's appraised value simultaneously.
Four Levers That Move Hygiene from Break-Even to Profitable
The audit framework and indirect revenue analysis identify where a hygiene department stands. The four levers below address what to do about it, ordered by typical impact based on how quickly and durably each change tends to improve the contribution margin.
Lever 1: Service mix. Shifting from a prophylaxis-heavy schedule toward appropriate periodontal diagnosis and treatment is the highest-leverage change most practices can make. Scaling and root planing and perio maintenance codes reimburse at significantly higher rates than prophylaxis, and practices that reach 35% or more of hygiene visits involving periodontal services consistently outperform those below that threshold on both production and collection metrics. The practical starting point is a diagnosis protocol review: are hygienists documenting full periodontal charting consistently, and are findings being communicated to patients with a clear treatment recommendation? In many practices, the perio percentage is low not because patients don't have disease, but because the system for identifying and presenting it is inconsistent, even though nearly half of adults over 30 have some form of periodontal disease, rising to 70% for those over 65.
Lever 2: Fee schedule review. Hygiene fees in many practices have not been updated in three or more years. Annual increases of 3 to 5% compound meaningfully over time and are generally well within the range that patients accept without friction. For PPO-heavy practices, the more consequential question is whether contracted reimbursement rates are suppressing net collections to the point where selective renegotiation or plan exit makes financial sense. Practices that have evaluated this tradeoff carefully and dropped lower-reimbursing PPO plans often find that the reduction in patient volume is smaller than expected, while the improvement in net collection rate is substantial.
Lever 3: Reappointment systems. Each 1% improvement in reappointment rate adds roughly 10 to 15 additional hygiene appointments per year per hygienist. At $175 to $200 per appointment in net collections, that translates to $1,750 to $3,000 in additional annual revenue per hygienist from a systems change alone, with no increase in chair time or staffing. Practices that target an 85% or higher reappointment rate and build structured scheduling protocols around that goal tend to see this improvement within two to three months of consistent implementation.
Lever 4: Adjunctive services. Fluoride treatments, sealants, and oral cancer screenings are billable services that can be added to existing appointments without extending chair time. The incremental revenue per visit is modest, but applied across a full hygiene schedule, the annual impact is meaningful and the implementation barrier is low relative to the other levers.
Prioritization guidance: Owners whose profitability audit produced a ratio below 3:1 will generally see the fastest improvement by addressing service mix and reappointment systems first, since both affect net collections directly and durably. Owners already at or above the 3:1 threshold have a different optimization problem: the direct profitability baseline is sound, and the growth opportunity lies in indirect revenue metrics, particularly same-day treatment acceptance and restorative referral rates from hygiene exams. As Dental Economics notes, the hygiene department should function as the second-largest profit center in the practice, a standard that requires intentional systems across all four levers, not just one or two.
Hygiene profitability improvements also compound into practice value over time. A department generating consistent net collections, strong recall rates, and reliable restorative referrals is a materially different asset than one running at break-even, and buyers and appraisers price that difference into what a practice is ultimately worth.
Sources & References
The data and claims in this article are drawn from the following sources. We prioritize government data, peer-reviewed research, and established industry publications to ensure accuracy.
- [PDF] Dental PPO Collection Loss Analysis— cdr.lib.unc.eduAcademic
- What Dental Hygienists Earned in 2025— dimensionsofdentalhygiene.comIndustry
- Top 5 Hygiene Benchmarks for Dental Practices - Patient Prism— www.patientprism.comIndustry
- IRS employer tax guide— irs.gov
- Dental Hygienists - Bureau of Labor Statistics— www.bls.govGovernment
- Dental Office Overhead Percentages: 2026 Report - DentiMax— dentimax.comIndustry
- Dental Hygiene Recall Rates: The Key DSO Valuation Driver— mybcat.comIndustry
- 8 Strategies For A More Profitable Hygiene Department— www.docseducation.com
- Make Hygiene Profitable | Dental Economics— www.dentaleconomics.comIndustry
Ready to optimize your hygiene department's profitability?
Understanding your hygiene department's financial performance is crucial, but managing profitability requires more than just tracking metrics. Minty's operations team helps independent practices streamline their business operations, from staffing efficiency to revenue optimization, so you can focus on clinical excellence.