High No-Show Rate at a Dental Practice: What Buyers Need to Know

Co-Founder, Minty Dental
In Summary
- A no-show rate above 8% can suppress practice profitability by 23% or more — but whether that's a buying opportunity or a red flag depends entirely on the root cause
- The most important diagnostic split: systems problem (fixable) vs. structural problem (patient disengagement, payer mix, seller-dependent goodwill)
- Key metrics to request: no-show and cancellation rates by appointment type, cancellation lead time, hygiene recall compliance, reappointment rate, and 24–36 months of trend data
- A high confirmation rate paired with a high no-show rate points to patient behavior, not process — reminder software won't fix it
- Use the revenue gap calculation (no-show rate × annual appointments × average value) to anchor price negotiations to actual performance, not scheduled production
A High No-Show Rate Is a Diagnostic Signal, Not Just an Operational Nuisance
No-show rate defined: A no-show is a patient who misses a scheduled appointment without any advance notice. A cancellation involves some notice — but if the slot goes unfilled, the revenue impact is identical. Buyers often see these lumped together in seller disclosures, but they signal different things operationally. Chronic no-shows tend to reflect patient disengagement or friction in the reminder process. High cancellation rates with low fill rates often point to scheduling system failures or a front desk that lacks a same-day fill protocol.
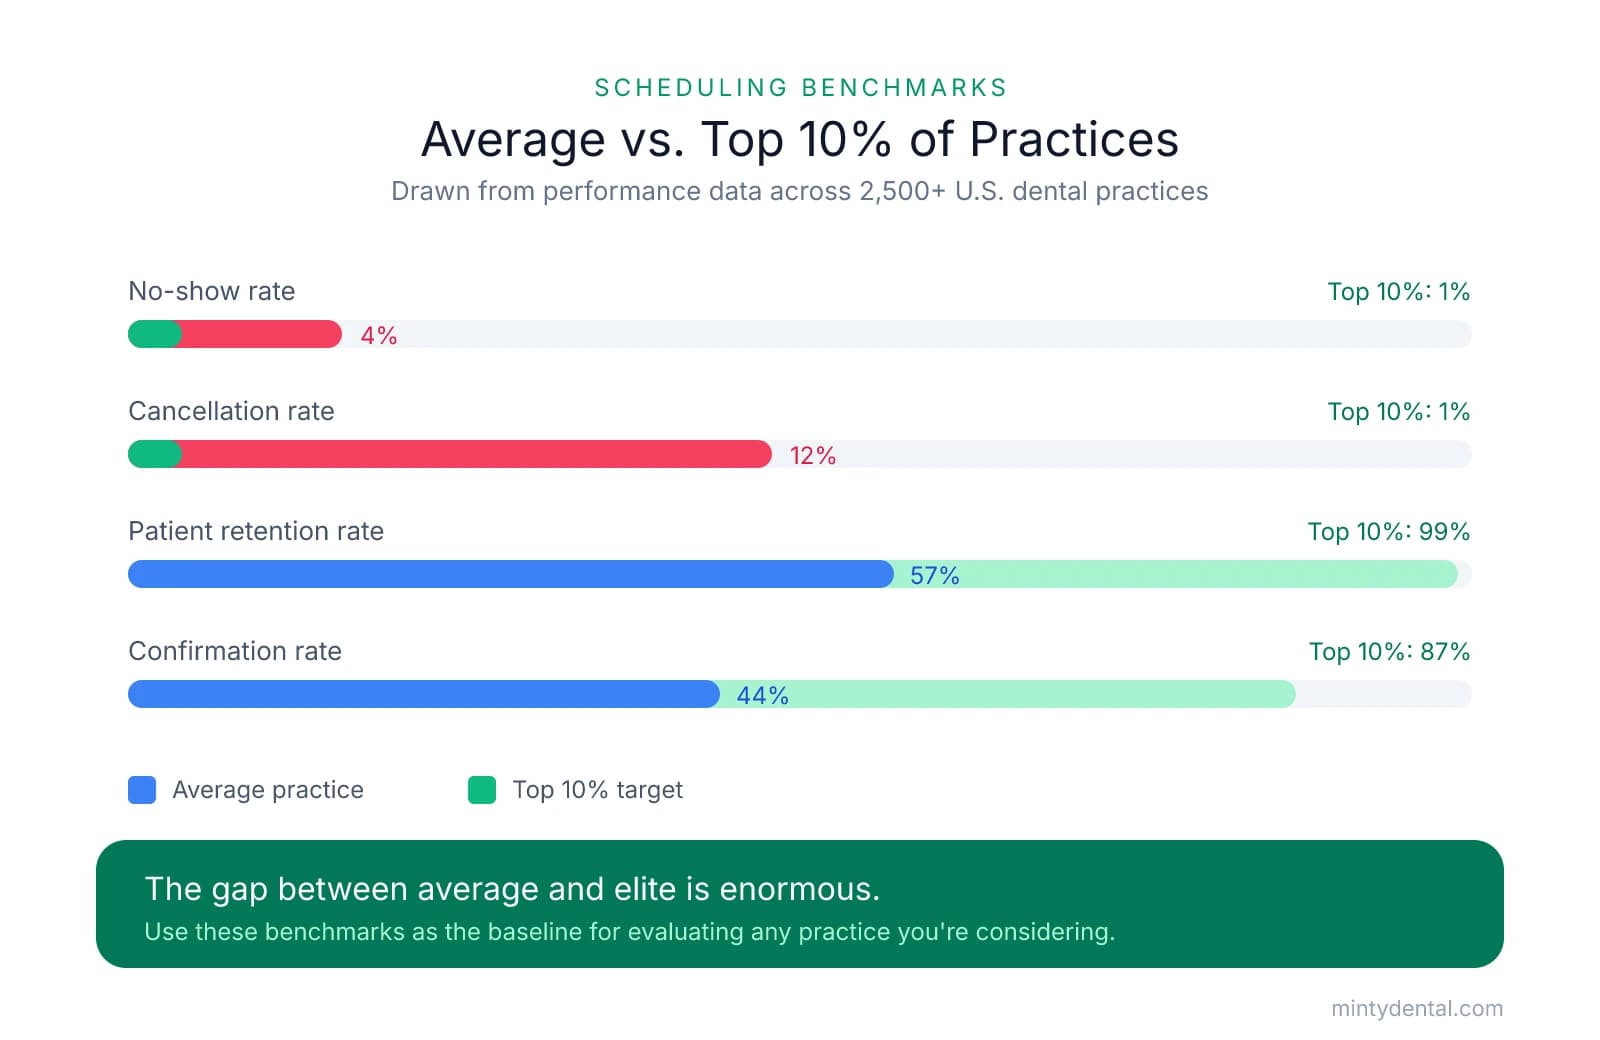
Keeping them separate matters because the fix — and the risk — differs for each.
| Metric | Average Practice | Top 10% of Practices |
|---|---|---|
| No-show rate | 4% | 1% |
| Cancellation rate | 12% | 1% |
| Patient retention rate | 57% | 99% |
| Confirmation rate | 44% | 87% |
According to Becker's Dental, these benchmarks were drawn from performance data across more than 2,500 U.S. dental practices — a reliable baseline for evaluating any practice you're considering.
When you encounter a practice with a 15% combined no-show and cancellation rate, the instinct is to treat it as a simple operational fix. That instinct isn't wrong — but it's incomplete. The more useful question isn't is this rate high? It's why is it high? The answer separates a practice with hidden upside from one carrying structural risk you'd be paying full price to inherit.
Root causes tend to fall into two broad categories. The first is fixable: no automated reminders, a weak recall system, long appointment lead times, or a front desk without a cancellation fill protocol. These are systems problems, and systems can be changed. The second is harder — structural issues like a Medicaid-heavy payer mix that correlates with higher no-show rates in the research literature, an aging patient base with declining mobility, or goodwill that lives almost entirely in the seller's personal relationships.
There's also a valuation dimension worth flagging early. A practice with a persistently high no-show rate is already collecting less than its schedule implies — which means either the asking price reflects that suppressed production, or it doesn't. Verifying which scenario you're in is one of the more important things you can do before making an offer, and it connects directly to how you'd approach negotiating price down after due diligence findings.
How to Read the Data: What to Request and What It Tells You
With that framing in place, the next step is pulling the right reports from the practice management system. A single headline number tells you almost nothing. The pattern behind it — broken out by appointment type, lead time, and trend — is where the diagnostic value lives.
1. No-Show and Cancellation Rate by Appointment Type
Ask for these figures broken out across hygiene, restorative, and new patient appointments. The distribution matters enormously:
- Hygiene no-shows suggest recall system failure or patient disengagement — often fixable
- Restorative no-shows can indicate financial barriers or treatment anxiety, which is harder to address operationally
- New patient no-shows often point to scheduling friction, long lead times, or a disconnect between how the practice markets itself and what patients experience at booking
A practice where no-shows are concentrated in hygiene looks very different from one where new patients are disappearing before they ever become active.
2. Cancellation Lead Time Breakdown
Not all cancellations carry equal weight. Same-day cancellations are nearly as damaging as no-shows — the slot almost never gets filled. Cancellations with 48 or more hours of notice are largely recoverable with a functioning waitlist.
Ask for cancellations segmented by lead time. A practice with a 12% cancellation rate that's mostly same-day has a materially different risk profile than one where most cancellations come in 72 hours ahead.
3. Hygiene Recall Compliance Rate
Hygiene recall compliance rate: The percentage of active patients who complete their recommended recall appointments within a given period. A healthy rate sits at 75% or above. Below 60% is a red flag regardless of the headline no-show rate — it signals that a meaningful portion of the patient base has quietly disengaged, compounding over time as those patients drift to competitors or stop seeking care.
4. Reappointment Rate and Confirmation Rate — Read Together
These two metrics reveal whether the scheduling system or the patients themselves are the source of the problem.
Per Becker's Dental, the average reappointment rate across U.S. practices is 77%, with top performers reaching 94%. Confirmation rates average 44%, with top practices hitting 87%.
The combination that warrants the most scrutiny: a high confirmation rate paired with a high no-show rate. When patients are confirming but not showing up, the problem isn't a systems gap — it's patient behavior. That pattern points toward dissatisfaction, financial barriers, or eroding trust, none of which get solved by upgrading reminder software.
A low confirmation rate with a high no-show rate, by contrast, often does point to a fixable process — no automated reminders, manual phone-tag, or an inconsistent confirmation protocol.
5. Trend Data Over 24–36 Months
A snapshot is the least useful form of this data. Request monthly or quarterly figures going back two to three years. A no-show rate that's been climbing steadily for 24 months is a fundamentally different risk than one that spiked after a specific event — a key staff departure, an insurance change, or a period of reduced hours.
Trending data also helps you cross-reference against production and collections reports. If no-show rates climbed while collections held steady, the practice may have compensated elsewhere. If both moved in the same direction, the revenue impact is real and should factor into your valuation — something worth working through alongside a careful read of the practice's P&L.
Fixable vs. Structural: The Distinction That Changes the Deal
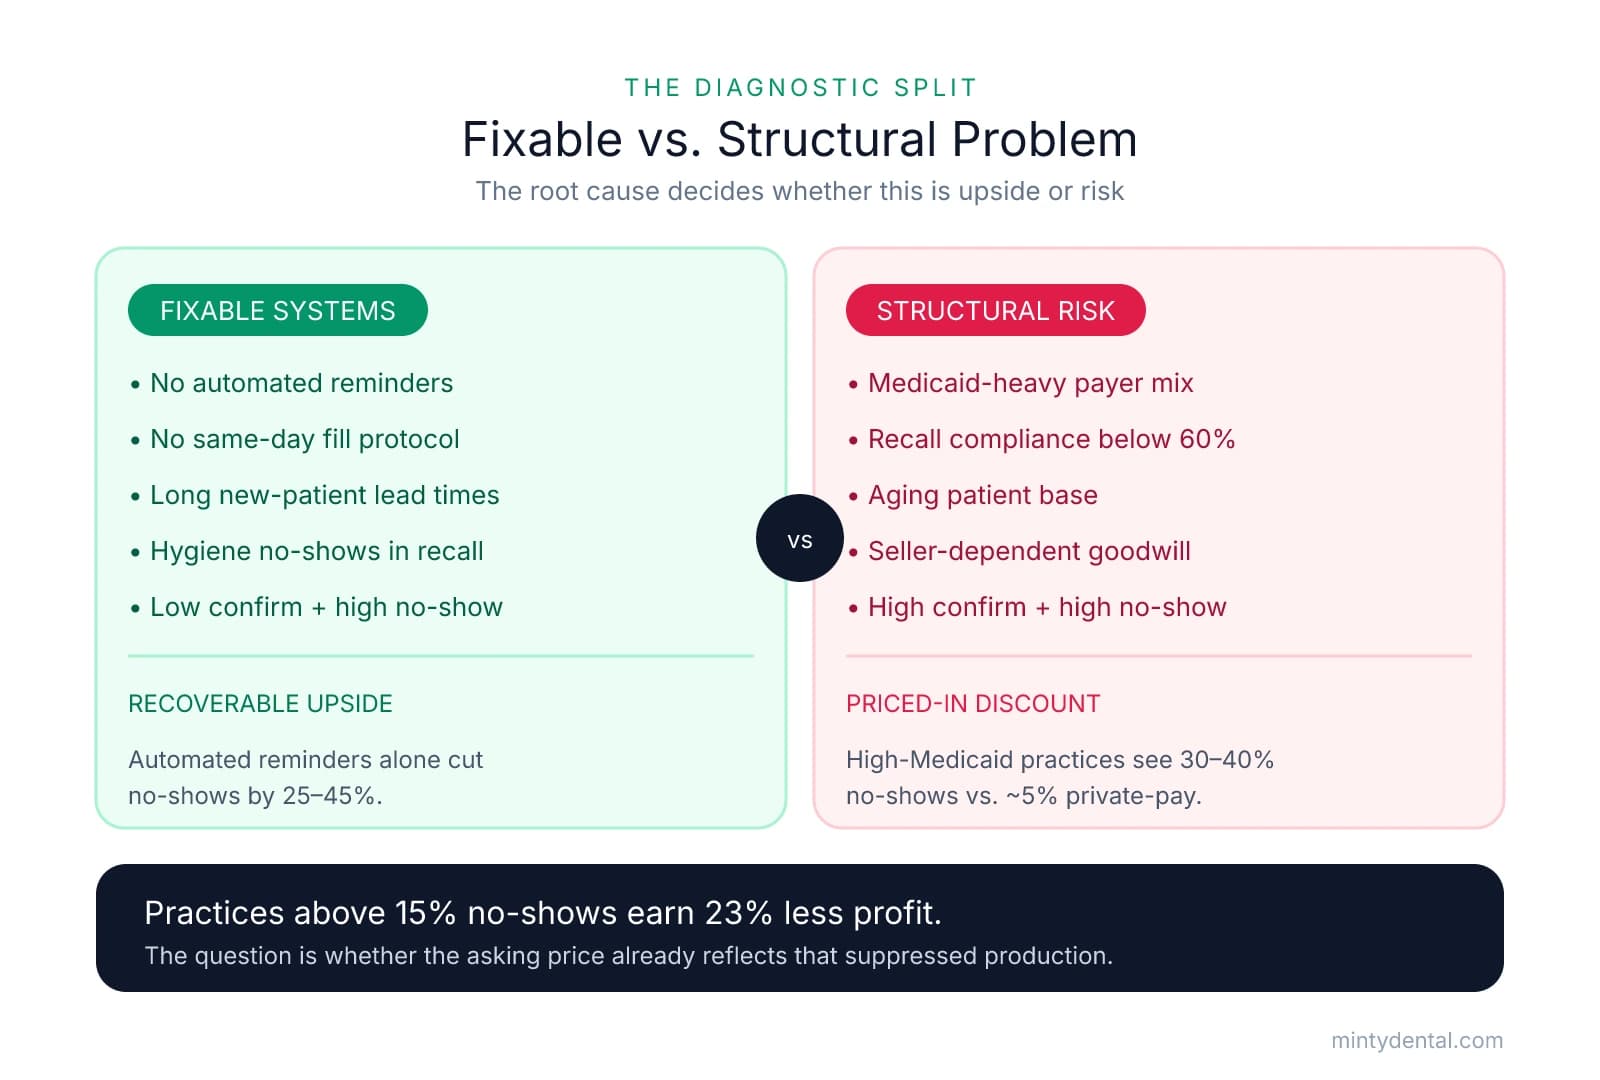
Once you've pulled the data and identified the pattern, the most important judgment call comes down to a single question: is this a systems problem or a people problem? The answer changes everything — the price you should pay, the protections you should negotiate, and whether the no-show rate represents upside you can capture or risk you'd be absorbing at full goodwill value.
Signals That Point to a Fixable Systems Gap
Some no-show problems are essentially infrastructure problems in disguise. If you find any of the following during due diligence, the elevated rate may be recoverable with modest investment after closing:
- No automated reminder system — practices without multi-channel automated reminders are leaving an obvious fix on the table
- No waitlist or same-day fill protocol — cancellations that could be recovered in hours instead go unfilled
- Long new-patient lead times — top-performing practices schedule new patients within 5.4 days; practices averaging 39 days lose patients before they ever become active, inflating apparent no-show rates
- Hygiene no-shows concentrated in recall — when the pattern is isolated to recall rather than restorative or new patient visits, it often reflects a broken recall process rather than disengaged patients
Automated reminder systems alone have been shown to reduce no-show rates by 25–45%, which translates directly to recoverable production.
Signals That Point to a Structural Problem
The picture looks different when the practice already has modern systems and the rate is still high. At that point, the problem isn't the infrastructure — it's the patients.
- Medicaid-heavy payer mix — no-show rates of 30–40% are common in high-Medicaid practices, compared to roughly 5% in private-pay practices; this also affects how much you can borrow against the practice
- Recall compliance below 60% — a meaningful share of the patient base has quietly disengaged, and that attrition tends to accelerate after a change of ownership
- Aging patient base — natural attrition from an older demographic compounds in ways no reminder software addresses
- Seller-dependent goodwill — patients loyal to the individual dentist, not the practice, are at elevated risk of leaving after the transition regardless of what the no-show rate shows today
That last point deserves particular attention. A practice where the seller has been the primary relationship for 20+ years may show a manageable no-show rate pre-closing — and then watch it climb as patients follow the departing dentist or disengage. Structural problems like this are exactly what patient retention guarantees are designed to address in deal structure.
The Profitability Gap — And Whether It's Already Priced In
According to the ADA's 2024 Health Policy Institute report, practices with no-show rates above 15% experience 23% lower profitability than those maintaining rates below 8%. The critical question isn't just whether that gap exists — it's whether the asking price already reflects it. A practice priced on peak scheduled production rather than actual collections may carry a valuation that doesn't account for the revenue the no-show rate is quietly suppressing.
Turning the Finding Into Leverage: Price, Structure, and Day-One Priorities
With a clear picture of what's driving the no-show rate, that picture should directly shape how you proceed. The framework below maps each scenario to a concrete response.
Path 1: Fixable Systems Gap — Don't Pay for Upside You'll Create
When the evidence points to a systems problem, the no-show rate represents genuine upside. The mistake many buyers make is paying a price that already assumes those improvements are in place.
Before accepting any asking price, quantify the revenue gap:
No-show rate × scheduled appointments per year × average appointment value = estimated annual lost production
A practice with 4,000 annual appointments, a 15% combined no-show and cancellation rate, and a $250 average appointment value is leaving roughly $150,000 in scheduled production on the table each year. Factor the improvement upside into your growth projections, but negotiate the price on current performance.
Path 2: Structural Problem — Use the Revenue Gap as a Negotiating Lever
A documented structural no-show problem is a defensible basis for a valuation adjustment. The same revenue gap calculation applies, but here you're not projecting upside — you're arguing that current collections already reflect a discount the asking price doesn't acknowledge. That's a conversation worth having with the seller, and a framework for negotiating price down that goes beyond general haggling.
Path 3: Seller-Dependent Goodwill — Structure the Deal, Not Just the Price
When the no-show risk is tied to the seller's personal relationships, price reduction alone doesn't solve the problem. Two tools worth negotiating:
- A meaningful transition period — ideally 60–90 days with defined patient-facing responsibilities, not a nominal two-week handoff. The seller employment agreement is where this gets documented and enforced.
- A patient retention earnout or guarantee — tying a portion of the purchase price to verified retention metrics over the first 12–18 months aligns the seller's incentives with yours through the period of highest attrition risk.
Day-One Priorities Post-Closing
Regardless of which path applies, the first 90 days after closing are when patient behavior is most malleable. Three things worth implementing immediately:
- Automated multi-channel reminders — a Sesame Communications study analyzing over 1.6 million appointments across 64 practices found that automated reminders reduced no-shows by nearly 23%. If the practice doesn't have this, it's the highest-ROI operational change available.
- Waitlist protocol for same-day cancellations — a simple, consistently executed fill process recovers production that would otherwise disappear.
- Hygiene recall reactivation campaign — identify patients overdue 12 months or more and run a targeted outreach sequence. This is often the fastest way to demonstrate momentum to staff and stabilize revenue through the transition.
The no-show rate is rarely just an operational footnote. When read correctly, it tells you something real about what you're buying — and gives you concrete tools to pay the right price for it.
Sources & References
The data and claims in this article are drawn from the following sources. We prioritize government data, peer-reviewed research, and established industry publications to ensure accuracy.
- Where dental practices stand on scheduling, patient retention— beckersdental.comNews
- Predicting no-shows for dental appointments - PMC - NIH— pmc.ncbi.nlm.nih.govGovernment
- top-performing practices schedule new patients within 5.4 days— dentaleconomics.com
- How to purchase with confidence— ada.orgIndustry
- Study reveals how automated patient appointment ...— us.dental-tribune.comNews
Ready to acquire a stable dental practice?
No-show rates are a critical due diligence factor when evaluating dental practices. Minty's acquisition experts help you identify red flags, assess patient retention quality, and negotiate based on realistic revenue potential.