How to Read a Dental Practice P&L as a First-Time Buyer

Co-Founder, Minty Dental

In Summary
- A dental practice P&L has four core sections: revenue (collections), cost of goods sold (supplies and lab fees), operating expenses, and net income — and net income is the starting point for analysis, not the conclusion
- Collections measure actual cash received; production measures what was billed — all overhead benchmarks are expressed as a percentage of collections, not production
- Healthy practices collect 95–98% of adjusted production; rates below 90% signal billing or accounts receivable problems that transfer to the new owner at closing
- Most sellers run personal and business expenses through the same P&L, which means reported net income almost always understates what the practice actually generates
- Adjusting for those personal expenses — a process called adding back — is the core skill that separates buyers who negotiate from a position of knowledge from those who overpay
The P&L Tells You What You'll Actually Earn — Not What the Seller Reports
A dental practice P&L, also called an income statement, summarizes all revenue and expenses over a defined period — typically a calendar year or trailing twelve months — and produces a net income figure at the bottom. That bottom line is where most first-time buyers stop reading. It's also where the most important analysis begins.
The reason: net income on a dental practice P&L is almost never what a new owner will actually earn. Most sellers run a mix of personal and business expenses through the same document — vehicle payments, personal insurance premiums, family payroll, retirement contributions — which compresses the reported profit. At the same time, some sellers pay themselves a below-market salary that inflates the apparent bottom line. The document reflects their ownership structure, not yours. Reading it at face value means you're evaluating someone else's financial life, not the practice's true earning power.
That's the reframe worth holding onto before you open a single spreadsheet: the P&L is a buyer's diagnostic tool, not an accounting summary.
The Four Core Sections
Every dental practice P&L follows the same fundamental structure:
- Revenue (Collections) — The actual cash received from patients and insurance companies after write-offs, adjustments, and PPO fee reductions. This is not gross billings, and it is not production.
- Cost of Goods Sold (COGS) — Dental supplies and lab fees. These are the direct costs of delivering clinical care.
- Operating Expenses — Everything else required to run the practice: staff wages, rent, utilities, marketing, software, and the owner's compensation.
- Net Income — What remains after all expenses. The starting point for your analysis, not the ending point.
Why Collections — Not Production — Is the Number That Matters
Production is what the practice billed at fee schedule rates. Collections is what it actually deposited. The gap between the two reveals front office efficiency, insurance contract quality, and accounts receivable health — and every overhead benchmark in dental practice valuation is expressed as a percentage of collections, not production.
A practice producing $900,000 but collecting $765,000 doesn't have $900,000 in buying power. It has $765,000. Lenders anchor to collections. Your debt service will anchor to collections. Your ability to pay yourself will anchor to collections.
Healthy practices collect 95–98% of adjusted production — the amount billed after contractual insurance write-offs. Collection rates below 90% tend to signal systemic problems: poor billing follow-up, uncollected patient balances, or fee schedules misaligned with payer contracts. Those problems don't resolve at closing — they transfer. A deeper look at how collections and production interact in an acquisition can help you pressure-test what a seller is reporting before you go further in the process.
With collections confirmed as your baseline, the next step is running every major expense line against industry benchmarks.
Benchmarking Every Expense Line: What Healthy Looks Like
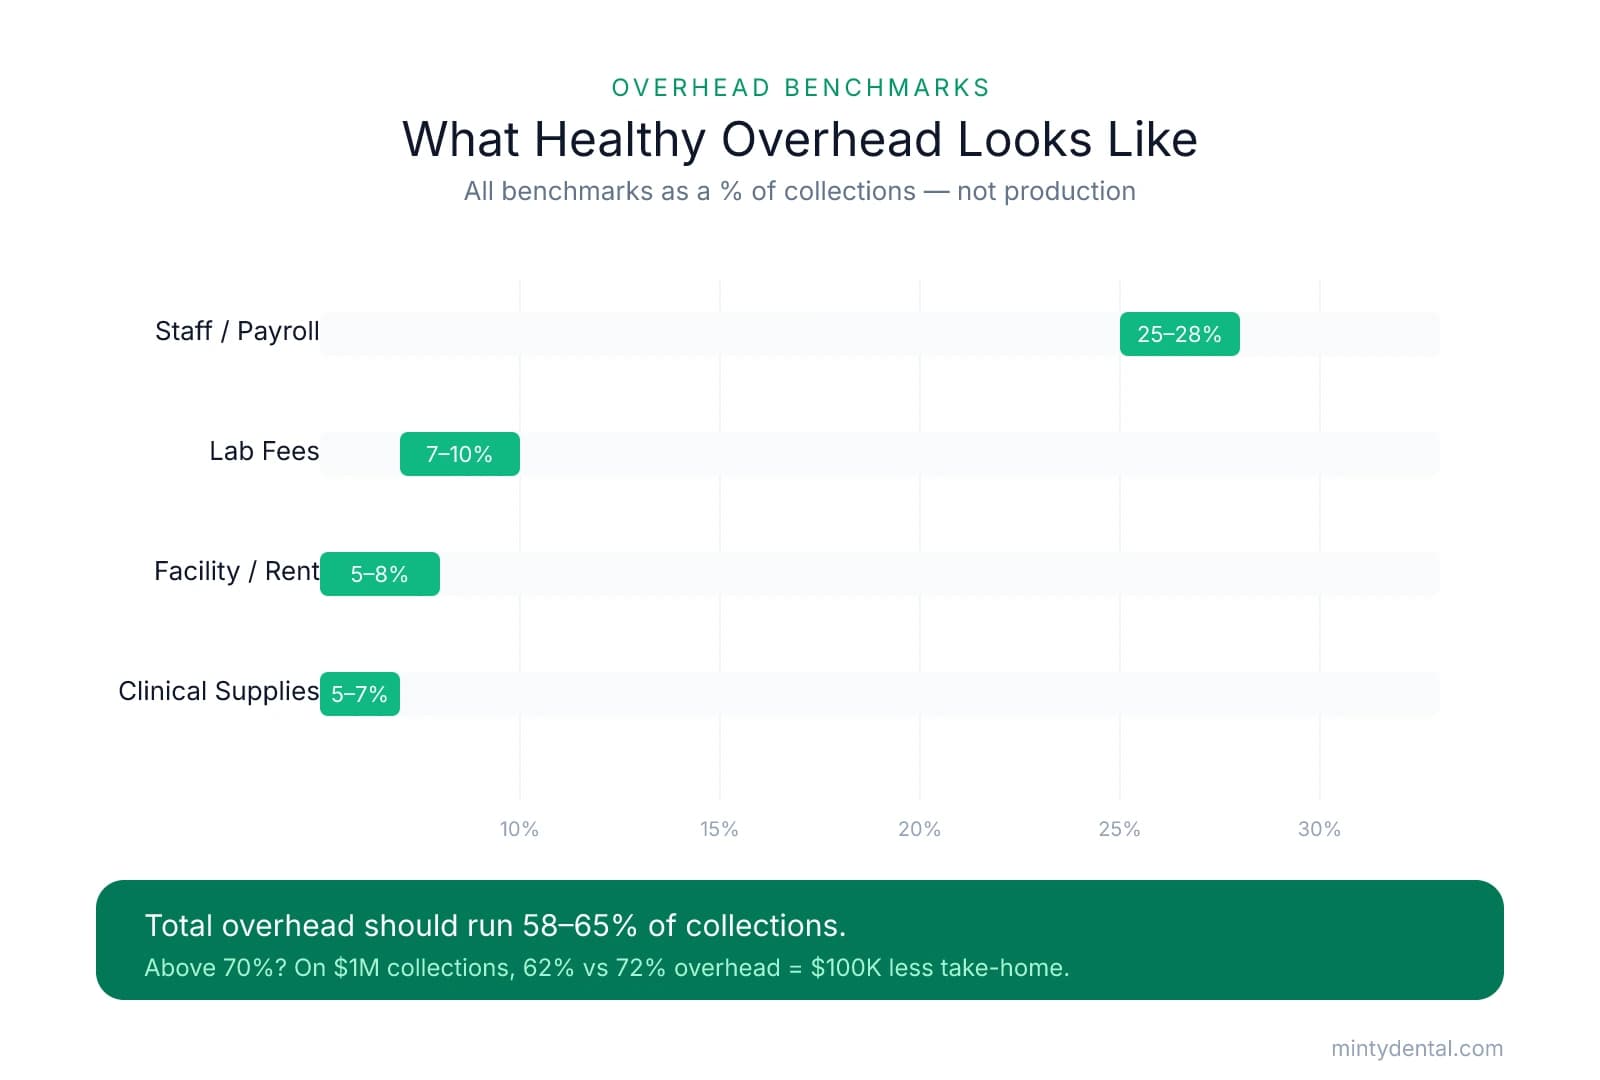
The core principle: total overhead (all expenses except owner compensation) should run 58–65% of collections in a healthy general practice. When that number climbs above 70%, the practice is generating significantly less owner income than the headline revenue suggests. The difference between 62% and 72% overhead on a practice collecting $1 million annually is $100,000 in take-home income.
Context worth keeping in mind: according to the ADA Health Policy Institute's 2025 Survey of Dental Practice, dental practice expenses grew 4.9% over five years while revenues grew only 1.4%. Practices that looked lean five years ago may have drifted into problematic overhead territory — which makes benchmarking current-year P&Ls more important than ever.
The Four Major Overhead Categories
| Expense Category | Healthy Range (% of Collections) | Worth Investigating When... |
|---|---|---|
| Staff / Payroll | 25–28% | Above 30% |
| Clinical Supplies | 5–7% | Below 4% or above 8% |
| Lab Fees | 7–10% | Below 4% or above 12% |
| Facility / Rent | 5–8% | Above 10% |
What Each Line Is Actually Telling You
Staff and payroll is typically the largest single overhead category. When it runs above 30%, the question isn't automatically "this practice is overstaffed" — it might mean a family member is on payroll at above-market compensation, or that a long-tenured hygienist is earning well above current rates. Both are legitimate add-back candidates, covered in the next section.
Clinical supplies running below 4% is a pattern worth paying attention to. It can mean the seller deferred purchases before listing — a temporary dip that becomes your expense post-closing. It can also indicate underdiagnosis: a practice that isn't presenting or completing treatment at a healthy rate simply won't consume much in supplies. Supplies above 8% typically point to poor vendor management or waste.
Lab fees vary more than any other category based on case mix. A restorative-heavy or implant-focused practice will legitimately run toward the higher end of the range. Lab fees below 4% in a general practice often signal limited case complexity — fewer crowns, fewer prosthetics, more basic hygiene-driven revenue. That's not disqualifying, but it shapes what the practice is worth. If you're evaluating a specialty acquisition, the benchmarks shift — buying an endo or perio practice involves meaningfully different overhead structures than a general practice.
Facility and rent above 10% of collections becomes a structural problem — especially if the seller owns the building and has set a lease rate that won't survive arm's-length negotiation. Rural practices often run lower than the benchmark. Urban practices above 10% deserve a close look at lease terms, remaining duration, and renewal options.
The goal isn't to find a practice where every line hits the benchmark perfectly — that practice doesn't exist. The goal is to understand what each deviation signals, so you can ask the right questions and adjust the price accordingly. Those adjustments start with calculating what the practice actually earns.
How to Calculate What You'd Actually Earn: The Add-Back Process
The number that answers every buyer's real question — what would I earn if I owned and worked in this practice? — is called Seller's Discretionary Earnings (SDE). It's built by starting with net income and systematically adding back expenses that belong to the seller's life, not the practice's operations.
Seller's Discretionary Earnings (SDE) is the total financial benefit a practice generates for an owner who both owns and works in it — before debt service, and before any personal spending decisions the next owner would make differently.
Here's how to build it, step by step.
Step 1: Start with net income Pull this from the bottom of the P&L. On a well-run practice collecting $1,000,000, you might see net income of $150,000–$200,000 after all reported expenses. That number is your starting point — not your answer.
Step 2: Add back owner compensation Add the seller's salary, W-2 wages, employer retirement contributions, and health and disability insurance premiums paid through the practice. This add-back typically runs $250,000–$350,000 or more, which is why the gap between reported net income and true SDE is often $300,000–$500,000 on a well-run practice.
Step 3: Add back personal expenses run through the business Common items include the owner's vehicle lease or depreciation, personal cell phone and internet, continuing education travel with a personal component, and family members on payroll at above-market rates. These are real expenses on the P&L — they just won't be your expenses.
Step 4: Add back non-recurring costs One-time equipment purchases, a website overhaul, legal fees from a resolved dispute, or emergency repairs inflate expenses in the year they occur but won't repeat. Removing them gives you a normalized picture of typical annual spending.
Step 5: Add back depreciation and amortization These are non-cash accounting charges — they reduce reported income without representing actual cash leaving the practice.
A Worked Example
| Item | Amount |
|---|---|
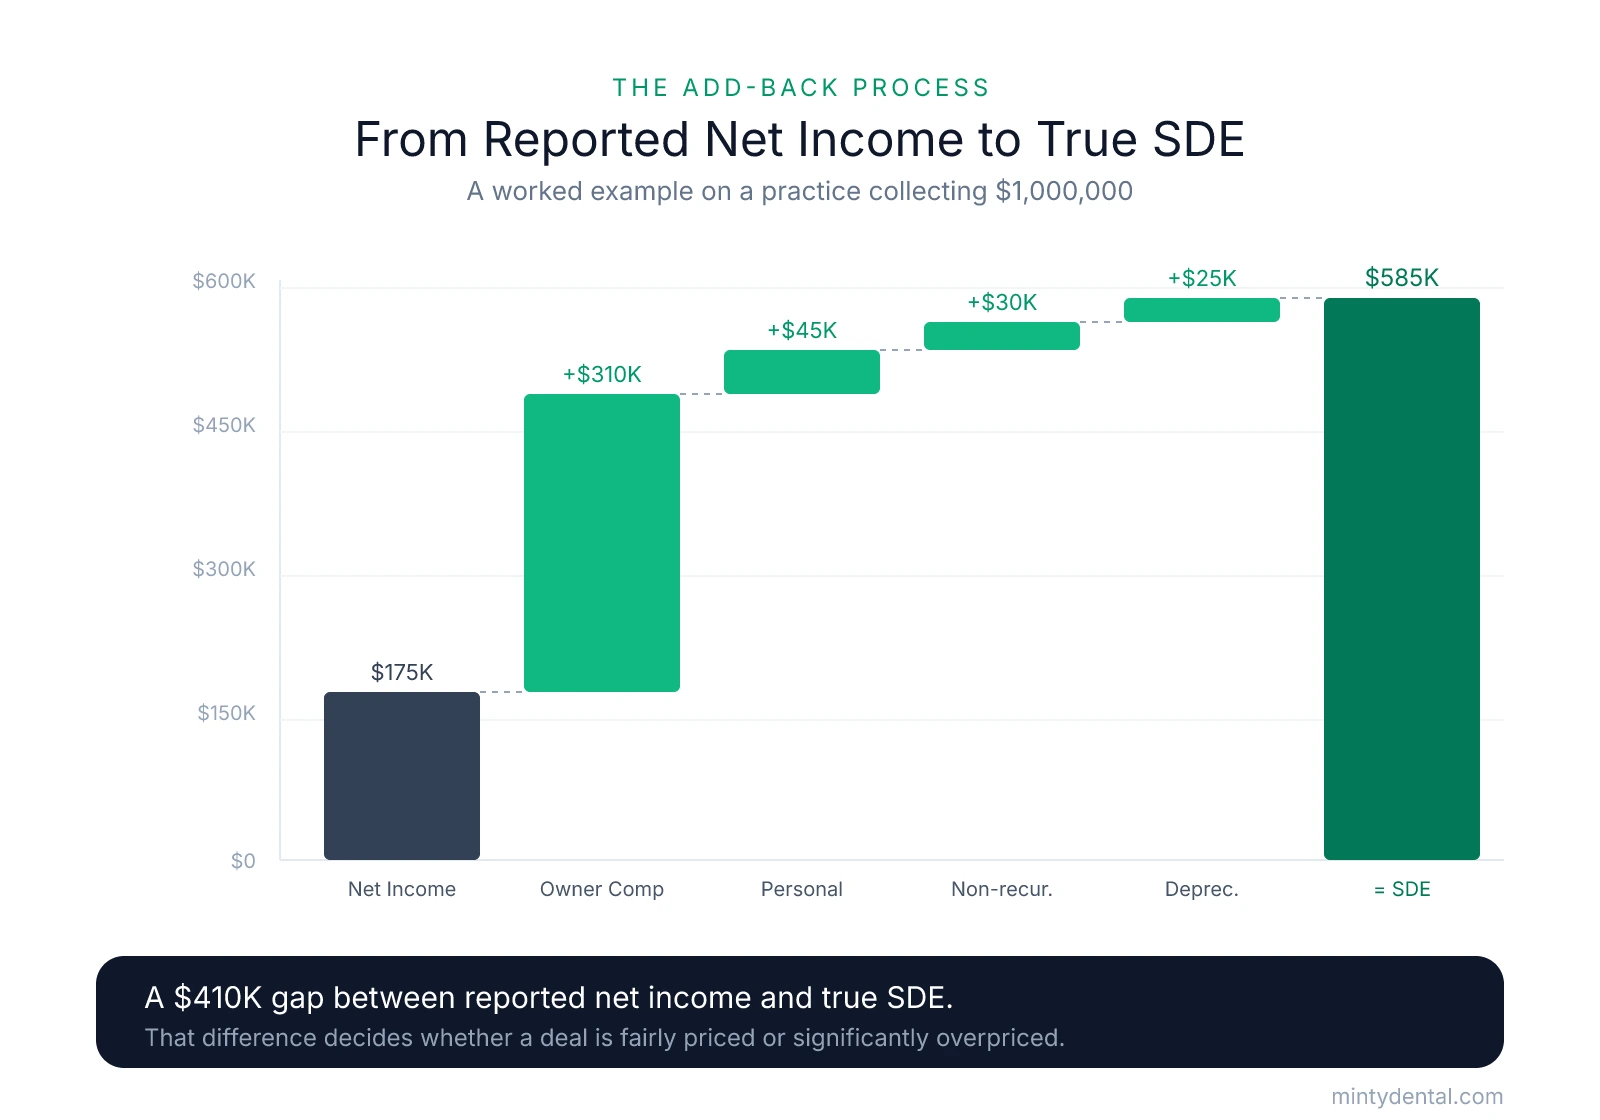
| Net Income (reported) | $175,000 |
| + Owner salary and benefits | $310,000 |
| + Personal expenses (vehicle, insurance, family payroll) | $45,000 |
| + Non-recurring costs (equipment, legal) | $30,000 |
| + Depreciation and amortization | $25,000 |
| = SDE | $585,000 |
That's a $410,000 gap between what the P&L reports and what the practice actually generates — a difference that determines whether a deal is fairly priced or significantly overpriced.
SDE vs. EBITDA: Which Metric Applies to Your Deal
For most doctor-to-doctor acquisitions — practices under roughly $1.5 million in annual revenue — SDE is the right metric. It reflects what you'll personally earn as the owner-clinician. DSOs and institutional buyers use EBITDA instead, which normalizes owner compensation to a market-rate associate cost — because those buyers aren't buying themselves a job.
If you're evaluating a standard single-location acquisition, SDE is your number.
Cross-Reference Against Tax Returns
One protection worth building into your process: request three to five years of filed tax returns alongside the P&L. Consistent discrepancies between internal financials and what was reported to the IRS — revenue that appears on the P&L but not the return, or expense patterns that shift dramatically year to year — warrant a direct explanation before you proceed. Isolated differences are common; a pattern is a red flag.
From SDE to Your Actual Take-Home
SDE tells you what the practice generates. To estimate your first-year take-home, subtract your projected annual debt service — acquisition loan payments plus any working capital line. How SDE flows into purchase price and how goodwill allocation affects your tax position are both worth modeling before you finalize an offer — the Purchase Price Allocation Calculator can help you run those numbers against different deal structures.
Red Flags That Don't Show Up in the Headline Numbers
SDE gives you the foundation. But the buyers who navigate acquisitions most successfully take one more step: they use the P&L to generate questions, not just answers. The numbers that look clean on the surface are often the ones worth pressing hardest.
P&L and tax return reconciliation gaps. Compare internal financials and filed federal tax returns side by side — ideally three years of each. A consistent pattern where internal financials show significantly higher income than what was reported to the IRS deserves a direct explanation before you proceed.
A/R ratios above 1.0. A healthy practice carries total receivables roughly equal to one month of average production. As dental accountants who specialize in acquisitions note, a ratio above 1.0 signals that patients aren't trained to pay promptly — a collection culture problem that transfers at closing. Ask for an aged A/R report broken down by 30, 60, 90, and 90+ day buckets before assigning any value to the receivables balance.
Expense spikes or disappearances in the 12–24 months before sale. Sellers sometimes defer maintenance, cut marketing spend, or reduce discretionary costs before listing — all of which inflate short-term profitability. If supplies drop below 4% of collections or marketing spend disappears, request two to three prior years of data to establish what normal actually looks like.
Staff costs that are unusually low. Payroll running below 22% of collections can look like efficiency. More often it reflects staff who are undercompensated relative to market — and who will push for raises or leave once the transition removes their loyalty to the outgoing doctor. Model the cost of bringing compensation to market rates before finalizing your offer.
Rent that seems artificially low. When the seller owns the building, the lease rate on the P&L may reflect an informal arrangement that won't survive arm's-length negotiation. A deeper look at buying a practice where the seller owns the real estate is worth the time — post-closing lease terms can meaningfully change the overhead picture you underwrote.
Every anomaly the P&L surfaces should generate a specific question answered by production reports, tax returns, or a dental CPA who works in acquisitions. Buyers who reach that conversation equipped with a benchmarked, add-back-adjusted P&L are in a fundamentally different position than those who rely on the seller's summary — and that position shows up in the price they pay, the terms they negotiate, and the practice they actually inherit. Those findings translate directly into price adjustments at the negotiating table.
Sources & References
The data and claims in this article are drawn from the following sources. We prioritize government data, peer-reviewed research, and established industry publications to ensure accuracy.
- Healthy practices collect 95–98% of adjusted production— ndptransitions.com
- Dental Practice Research— www.ada.orgIndustry
- 7 Ways Seller Discretionary Earnings Boost Practice Value— usdentalpractices.comIndustry
- SDE vs EBITDA for Dental Practice Valuation Guide— professionaltransition.comIndustry
- Financial Due Diligence for Dental Practices— duckettladd.comIndustry
Ready to evaluate your first dental practice?
Understanding P&L statements is crucial, but navigating the acquisition process requires expert guidance. Minty's team walks you through every step from initial search to closing, helping you identify and evaluate practices with confidence.