How Many New Patient Calls Is Your Dental Front Desk Losing?

Co-Founder, Minty Dental

In Summary
- Dental practices miss an estimated 30 to 38 percent of inbound calls during business hours, and many of those callers do not try again.
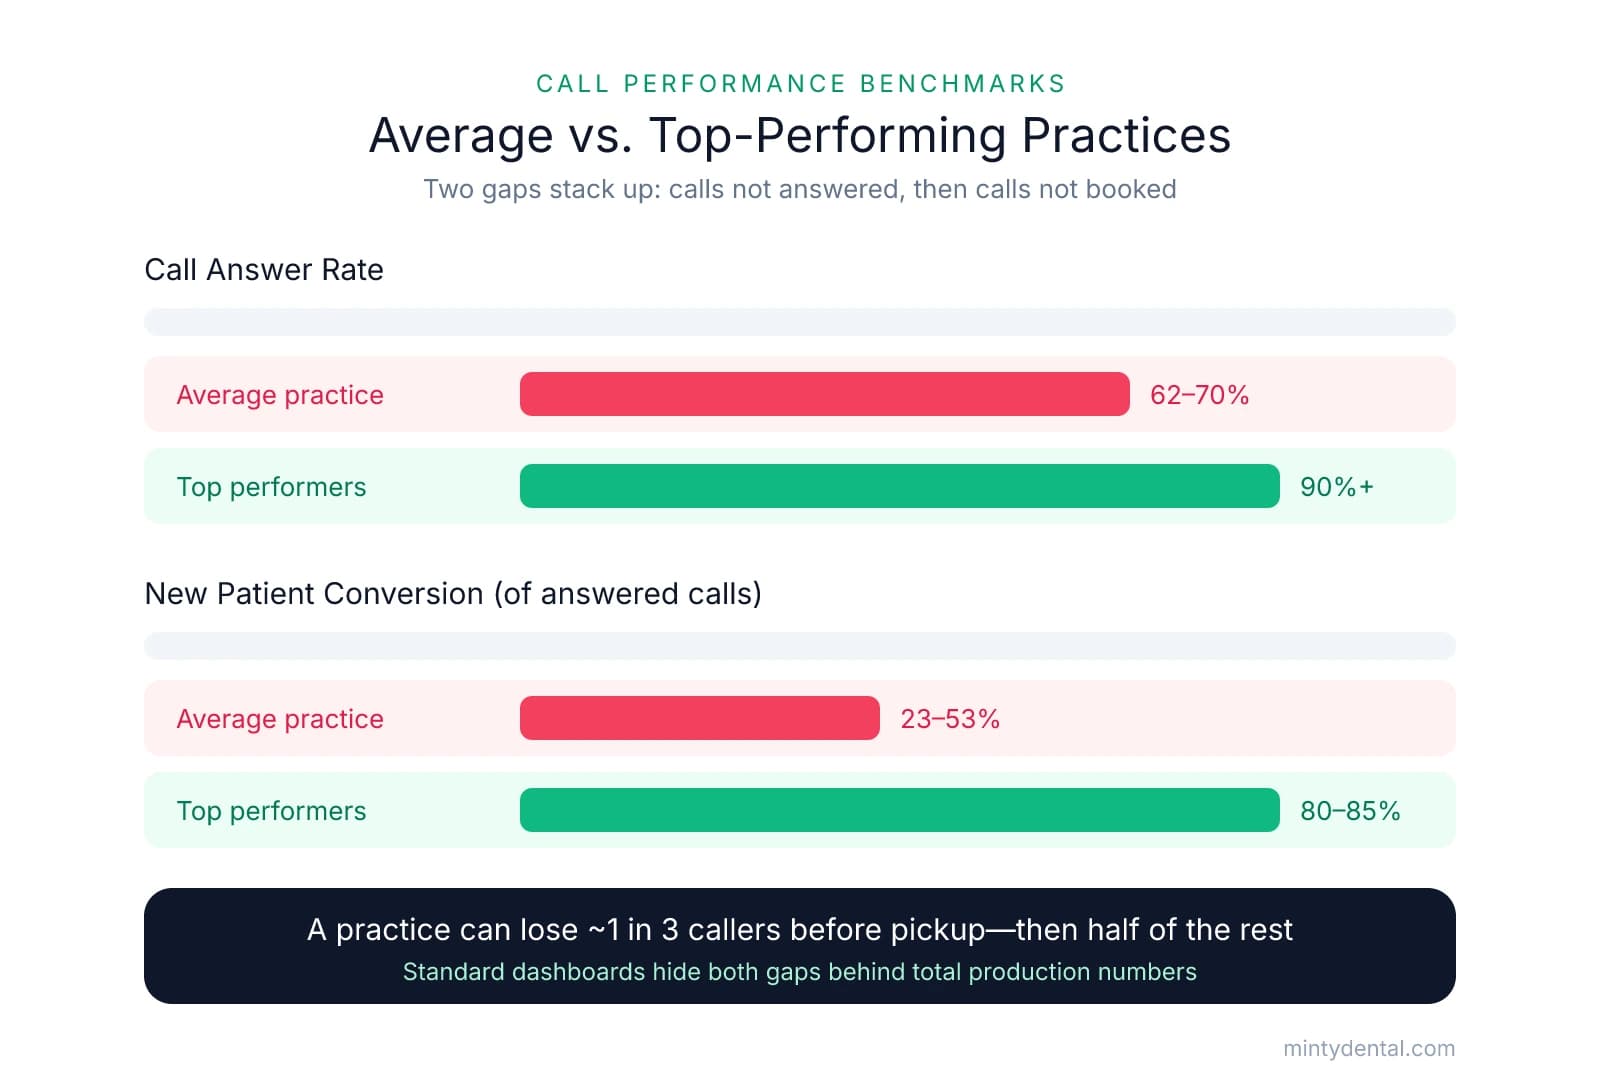
- Of the calls that are answered, the average practice books only 23 to 53 percent of new patient inquiries, while top performers convert 80 to 85 percent.
- Two separate problems drive the loss: unanswered calls, which convert at zero, and answered calls that fail because of a process or training gap.
- Voicemail is an unreliable backstop because most callers who reach it hang up without leaving a message, and many call a competitor instead.
- The phone remains the dominant scheduling channel, so a small improvement in answer and conversion rates can recover meaningful revenue.
Most Practices Lose 30–50% of New Patient Calls Before Anyone Speaks
Dental practices miss between 30 and 38 percent of inbound calls during business hours, which means roughly one in three callers reaches no one at the point of contact. A 4,280-call analysis across a 26-practice group found that 38 percent of inbound calls went unanswered, with no live pickup and no reliable follow-up. That figure aligns with wider industry benchmarks, and many missed calls involve new patients or high-value opportunities.
The loss compounds because roughly 67 percent of dental patients prefer scheduling appointments by phone, making missed calls a direct hit to the primary scheduling channel for new patients.
Two distinct problems create the gap, and they call for different fixes.
- Unanswered calls are a zero-conversion event. The caller never speaks to anyone, so no amount of front desk skill can recover the booking in that moment. This is a staffing, coverage, and call-routing issue.
- Answered but unconverted calls are a training and process gap. In the group study, answered new patient calls converted to appointments only about 25 percent of the time, compared with roughly 56 percent for existing patients. Across the industry, average new patient conversion tends to fall between 23 and 53 percent, while top-performing practices book 80 to 85 percent.
Most dashboards show total appointments and production, so neither problem is visible. A practice can look healthy while losing a third of its callers before the front desk answers, then losing half of the rest during the conversation.
| Metric | Average practice | Top performers |
|---|---|---|
| Call answer rate | 62–70% | 90%+ |
| New patient conversion (of answered calls) | 23–53% | 80–85% |
Voicemail rarely closes the gap, because most callers who reach it hang up without leaving a message, and a large share call a competitor instead of trying again. The result is that recovering these calls depends less on marketing spend and more on measuring what happens at the point of contact.
How to Calculate Your Practice's Actual Call Loss Rate
Benchmark averages may not match your practice's numbers, and the only way to know is to build the calculation from your own data. Most owners are surprised by the result because these numbers are rarely surfaced automatically.
Step 1: Pull total inbound call volume. Export the last 30 to 60 days of call data from your phone system or VoIP dashboard. Most modern systems log answered and missed calls automatically, so you can see total volume and the answered-versus-missed split in one report. A 60-day window smooths out weekly variation and holiday weeks.
Step 2: Calculate your answer rate. Divide answered calls by total calls. A rate below 80 percent usually points to a coverage problem rather than a training one, because it means calls are arriving when no one is available to pick up. That is a staffing, routing, or overflow issue you address differently than a scripting gap.
Step 3: Estimate new patient call volume. Use the industry estimate that roughly 15 to 25 percent of a practice's inbound calls are new patient inquiries as a starting point. Some call tracking tools tag these automatically. If yours does not, sample a few days of recordings to estimate your own percentage, then apply it to total volume.
Step 4: Compare scheduled to received. Pull the count of new patients scheduled from your practice management software for the same period. Divide that by your estimated new patient calls to get a rough conversion rate. This is approximate, but it tells you whether your loss sits closer to the average or the top-performer range.
Step 5: Run a call recording audit or mystery call. The first four steps quantify the loss. This step diagnoses why answered calls fail. Listen to a sample of recorded new patient calls, or arrange a mystery call from someone posing as a new patient. Score whether the team asks for the appointment, handles insurance questions without deflecting to a callback, and closes with a confirmed date.
A conversion rate below 60 percent on answered new patient calls generally indicates a training gap, while a rate below 40 percent points to a systemic process problem such as understaffing, missing scripts, or chronic turnover at the front desk that prevents any consistent standard from taking hold.
Where Calls Drop: The Three Failure Points and What Drives Each One
New patient calls fail at three distinct points: before the call is answered, during the conversation, and at the moment the appointment should be booked. Each has a different cause, and each shows up differently in your audit data.
Failure Point 1: The call is never answered. Unanswered calls cluster during predictable windows, typically 8 to 10am and 12 to 2pm, when appointment starts and lunch coverage collide with peak inbound volume. When one person is checking out a patient, another is at lunch, and a third line rings, the call goes to voicemail. This is a structural problem, so motivation and reminders rarely fix it. A coverage protocol that assigns phone responsibility during lunch and staggers breaks so at least one trained person is always available tends to move the answer rate more than any script. The signal in your data is a low answer rate concentrated in specific hours rather than spread evenly across the day.
Failure Point 2: The call is answered but not engaged. Here the team picks up and treats the call as an information request instead of a scheduling conversation. Common signs include reading insurance networks off a list, quoting a price without offering an appointment, and letting the caller control the direction of the call.
Insurance questions are the most frequent conversion killer. Many teams hear "do you take my insurance?" as a yes-or-no gate and end the call when the answer is complicated, rather than treating the question as the start of a scheduling conversation. Price questions are the second most common drop point for the same reason: the caller asks, the team answers, and no one bridges to booking.
| Scenario | Common response | Higher-converting response |
|---|---|---|
| "Do you take my insurance?" | "Let me read you our list" or "No, sorry" | "We work with most plans. Let's get you scheduled and verify your benefits before the visit." |
| "How much is a cleaning?" | Quotes a flat number, then silence | Gives a range, then pivots: "The exam lets the doctor confirm what you actually need. What day works?" |
| "I'll call back to schedule" | "Sure, we're here" | "I have Thursday at 2 or Friday morning. Which is easier?" |
Failure Point 3: The call is engaged but never closed. The team builds rapport but ends without asking for the appointment directly, or offers a vague next step like "call us back when you're ready." The call ends with no confirmed date. Mystery call data found that 60 percent of offices never attempted to schedule the caller, even when the caller expressed pain and readiness to book. The same reluctance to ask directly often appears in the operatory, which is why low case acceptance and low call conversion frequently travel together.
Calculating the Revenue at Stake and Prioritizing the Fix
Once you know your answer rate and conversion rate, you can translate the loss into a dollar figure. Use conservative inputs so the result holds up to scrutiny:
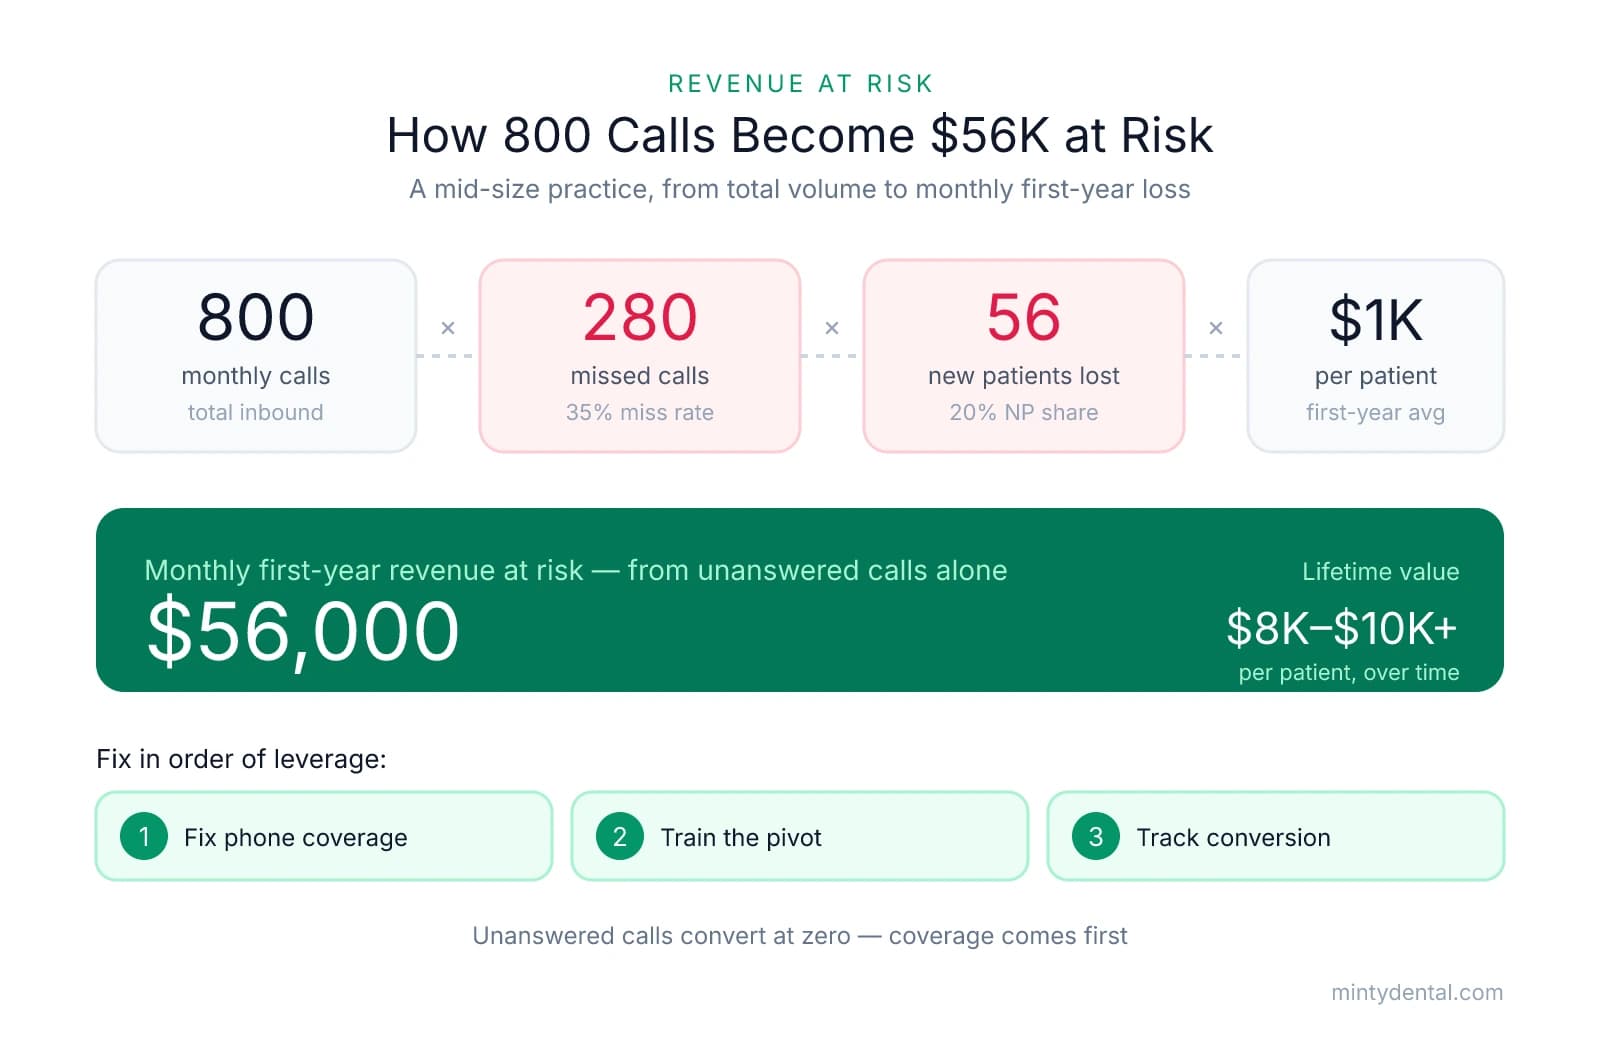
(monthly inbound calls × miss rate) × (new patient call share) × (first-year production value) = monthly first-year revenue at risk from unanswered calls alone.
Consider a mid-size practice receiving 800 calls per month with a 35 percent miss rate and a 20 percent new patient call share. That is 280 missed calls, of which roughly 56 are new patients who never reach anyone. At a first-year production value of $850 to $1,300 per new patient, or about $1,000 on average, the practice puts roughly $56,000 per month in first-year production at risk before the front desk says a word. That figure counts unanswered calls only. Lifetime value, which ranges from $8,000 to $10,000 or more depending on case mix and retention, makes the compounding cost larger over time.
That math also explains the order of the fixes. Unanswered calls convert at zero, while a low-converting answered call still produces some patients. A team that books 70 percent of answered calls still loses more revenue from calls no one picks up than from its conversion gap. Coverage comes first for that reason.
The three interventions, in order of leverage:
-
Fix phone coverage during peak windows. Assign clear phone responsibility when inbound volume is highest.
-
Train the team on the scheduling pivot. Improve how answered calls move from questions to booked appointments.
-
Implement call tracking to measure conversion monthly. Tracking creates ongoing accountability and shows whether the first two fixes are holding.
Beyond monthly revenue, a documented and measurable new patient system affects what the practice is worth. Practices with tracked call conversion and repeatable acquisition data tend to be more attractive to buyers and lenders when it comes time to sell, because the revenue is demonstrably repeatable rather than dependent on the owner. Phone performance you can prove becomes an asset a buyer can underwrite.
Sources & References
The data and claims in this article are drawn from the following sources. We prioritize government data, peer-reviewed research, and established industry publications to ensure accuracy.
- The economics of missed calls: Quantifying revenue loss in dental ...— www.dentaleconomics.comIndustry
- We Analyzed 4,280 Dental Patient Calls Across 26 Practices. Here's ...— peerlogic.comIndustry
- roughly 67 percent of dental patients prefer scheduling appointments by phone— ada.org
- Why Your Dental Practice Is Losing 1 in 3 New Patient Calls (And Doesn't ...— schedulinginstitute.comIndustry
- The Most Common Dental Call Mistakes—And How to Fix Them— schedulinginstitute.comIndustry
- 3 Ways to Improve Your New Patient Conversion Rate— mgeonline.comIndustry
Stop Losing New Patient Calls Today
Your front desk handles more than scheduling. Minty's operations team optimizes patient communication systems and staff training to capture every opportunity. Let us help you convert more callers into patients.