Dental Practice P&L Shows Profit but Bank Is Empty

Co-Founder, Minty Dental
In Summary
- Your P&L (income statement) shows whether the practice made money during a period, but it does not show every dollar that left the bank account.
- A practice can report $40,000 in net income for the month and still see almost no change in its bank balance, because several major cash outflows never appear on the P&L.
- Loan principal payments, equipment purchases, and owner distributions all reduce your cash but do not show up as expenses on the P&L.
- Insurance payment timing, payroll cycles, and bulk supply orders can create cash shortfalls even when production and collections are strong.
- Reading a cash flow statement alongside your P&L is the only way to see where the money actually went.
Your P&L Shows Whether You Made Money, Not Whether You Have Any
A profit and loss statement (also called an income statement) summarizes your revenue, operating expenses, and net income over a specific period, usually a month, quarter, or year. Its job is to answer one question: did this practice make money during that time?
What it does not do is explain what happened in your bank account.
Most dental practices run on cash-basis accounting, which means revenue is recorded when payment is received and expenses are recorded when they're paid. That keeps the P&L relatively close to reality for day-to-day operations, but it still leaves out several categories of cash that move in and out of your account. The P&L captures operating revenue and operating expenses. It does not capture everything.
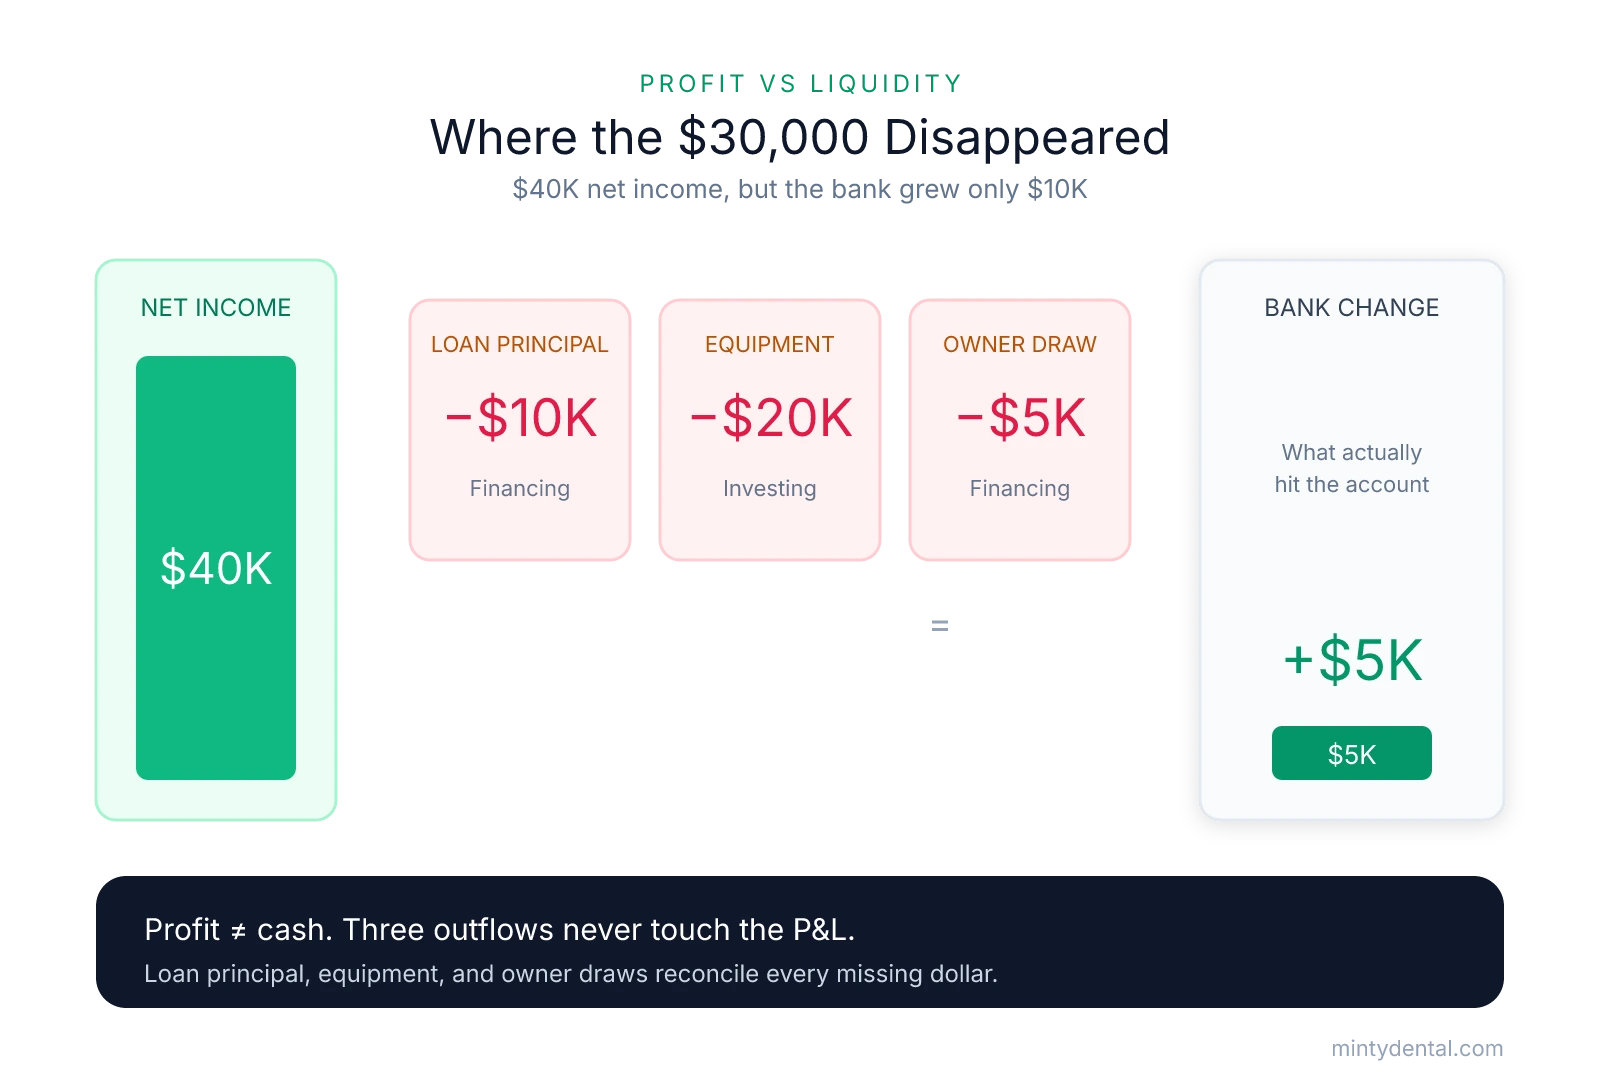
To make this concrete, consider a hypothetical example. Say your practice collects $120,000 in a month. Payroll, supplies, lab fees, rent, and other operating costs total $80,000. Your P&L shows $40,000 in net income. That looks healthy. But when you check the operating account at month's end, the balance grew by only $10,000. Somewhere, $30,000 disappeared between the P&L and the bank statement.
That gap is not an error and it's not embezzlement. It's the difference between profitability and liquidity, and the P&L only measures one of them. Profitability tells you whether the practice generated more revenue than it spent on operations. Liquidity tells you whether cash is actually available when you need it. A practice can be genuinely profitable on paper while running short on cash at the same time, and that's exactly what many owners experience month after month.
The $30,000 gap in the example above might reflect a loan principal payment that reduced the bank balance without appearing as an expense, a piece of equipment purchased outright, or a distribution taken by the owner. None of those transactions show up as operating expenses — they fall below Net Operating Income, or what's left after operational costs but before debt, taxes, and personal draw. The P&L-focused KPIs most owners watch, collection rate, overhead percentage, net income, simply aren't built to surface them.
Understanding this isn't just an accounting technicality. It's the reason a profitable practice can find itself scrambling to cover payroll.
Three Cash Drains the P&L Doesn't Show
The $30,000 gap from that hypothetical example has to come from somewhere. In most cases, it traces back to one or more of three categories of cash outflows that the P&L simply isn't designed to capture.
Loan principal payments
When you borrowed money to buy your practice or finance a buildout, your monthly debt payment covers two things: interest and principal. The P&L records the interest portion as an expense. The principal repayment, which is often the larger share of the payment, reduces your bank balance without leaving any trace on the income statement.
To make that concrete with a hypothetical example: a $3,000 monthly practice loan payment might include $500 in interest and $2,500 in principal. The P&L picks up the $500. The $2,500 reduces your bank balance and shows up only on the balance sheet as a reduction in your outstanding liability. If you have multiple loans, an equipment line, a real estate note, this effect compounds quickly. You can be looking at thousands of dollars leaving the account each month that your net income figure never reflects.
Equipment purchases
When you buy a piece of imaging equipment outright, say a hypothetical $50,000 CBCT scanner, the cash is gone on day one. But depreciation rules spread the P&L expense over several years, so your income statement might show only $10,000 of expense this year and $10,000 next year, while your bank account absorbed the full $50,000 immediately. Section 179 lets you accelerate the tax deduction into the purchase year, which helps at tax time, but the cash is still gone the moment you buy the equipment regardless of how the deduction is structured.
Financed equipment creates a related version of the same problem: you get the depreciation deduction up front, but then you're making loan payments for years, and only the interest on those payments is deductible. The principal runs out of the bank quietly, month after month.
Owner draws and distributions
Money you take out of the practice does not show up as an operating expense. Draws and distributions come out of equity, not income, so they're invisible to the net income calculation. A practice can report $40,000 in monthly profit while the owner has taken $35,000 in distributions, leaving almost nothing in the operating account. If overhead is already well-managed, draws are often the first place to look when the bank balance doesn't match the P&L.
Tax reserves
A profitable year creates a growing tax liability, but the P&L doesn't set cash aside to cover it. If quarterly estimated payments aren't part of your cash plan, a large April bill can compete directly with payroll and loan obligations. The practice was genuinely profitable; the cash just wasn't reserved. Every profitable dollar is partly spoken for before you spend it.
What the P&L records versus what leaves the bank
| Cash drain | What the P&L shows | What actually leaves the bank |
|---|---|---|
| Loan principal payment | Interest expense only | Full monthly payment (principal + interest) |
| Equipment purchase | Depreciation spread over years | Full purchase price on day one |
| Owner draws and distributions | Nothing | The full amount withdrawn |
| Tax liability on profit | Net income (pre-tax) | Quarterly estimates or lump April payment |
If you carry significant debt from a practice purchase or buildout, principal payments are almost certainly the primary culprit. If you've bought major equipment in the last year or two, check whether you paid cash or financed, and trace both the purchase and the ongoing payments. And if you take regular distributions, calculate what left the practice in draws over the last few months and compare it to the gap between net income and your ending bank balance. In many practices, it's a combination of all three running at the same time.
The Dental-Specific Timing Problem: Production, Collections, and AR
When a patient leaves your chair after a crown prep, you've produced revenue. But the cash from that appointment won't clear your bank account for weeks, sometimes longer. Production is recorded on the date of service; it reflects the dollar value of work performed that day. Collections is the money that actually hits the bank, recorded when payment clears. Those two numbers rarely line up in the same month, and the distance between them is where a lot of financial confusion in dental practices lives.
Insurance reimbursements typically arrive two to eight weeks after a claim is submitted, depending on the carrier, whether the claim required attachments, and whether it paid clean or came back with a request for additional information. Patient balances for anything beyond the copay collected at checkout can lag even further. The result is that your busiest production months don't necessarily show the highest collections. On a cash-basis P&L, a high-production month may show modest income because few prior claims have paid out yet, while a quieter month looks stronger on paper as a wave of older claims finally clears. If you're reading only the P&L, the practice can feel like it's underperforming during exactly the periods when your team is working hardest.
What sits in accounts receivable
Accounts receivable (AR) is the pool of revenue you've earned but haven't yet collected: submitted claims awaiting payment, patient balances after insurance processes, and anything still outstanding from prior months. AR itself isn't a problem; every practice carries some. The question is how much.
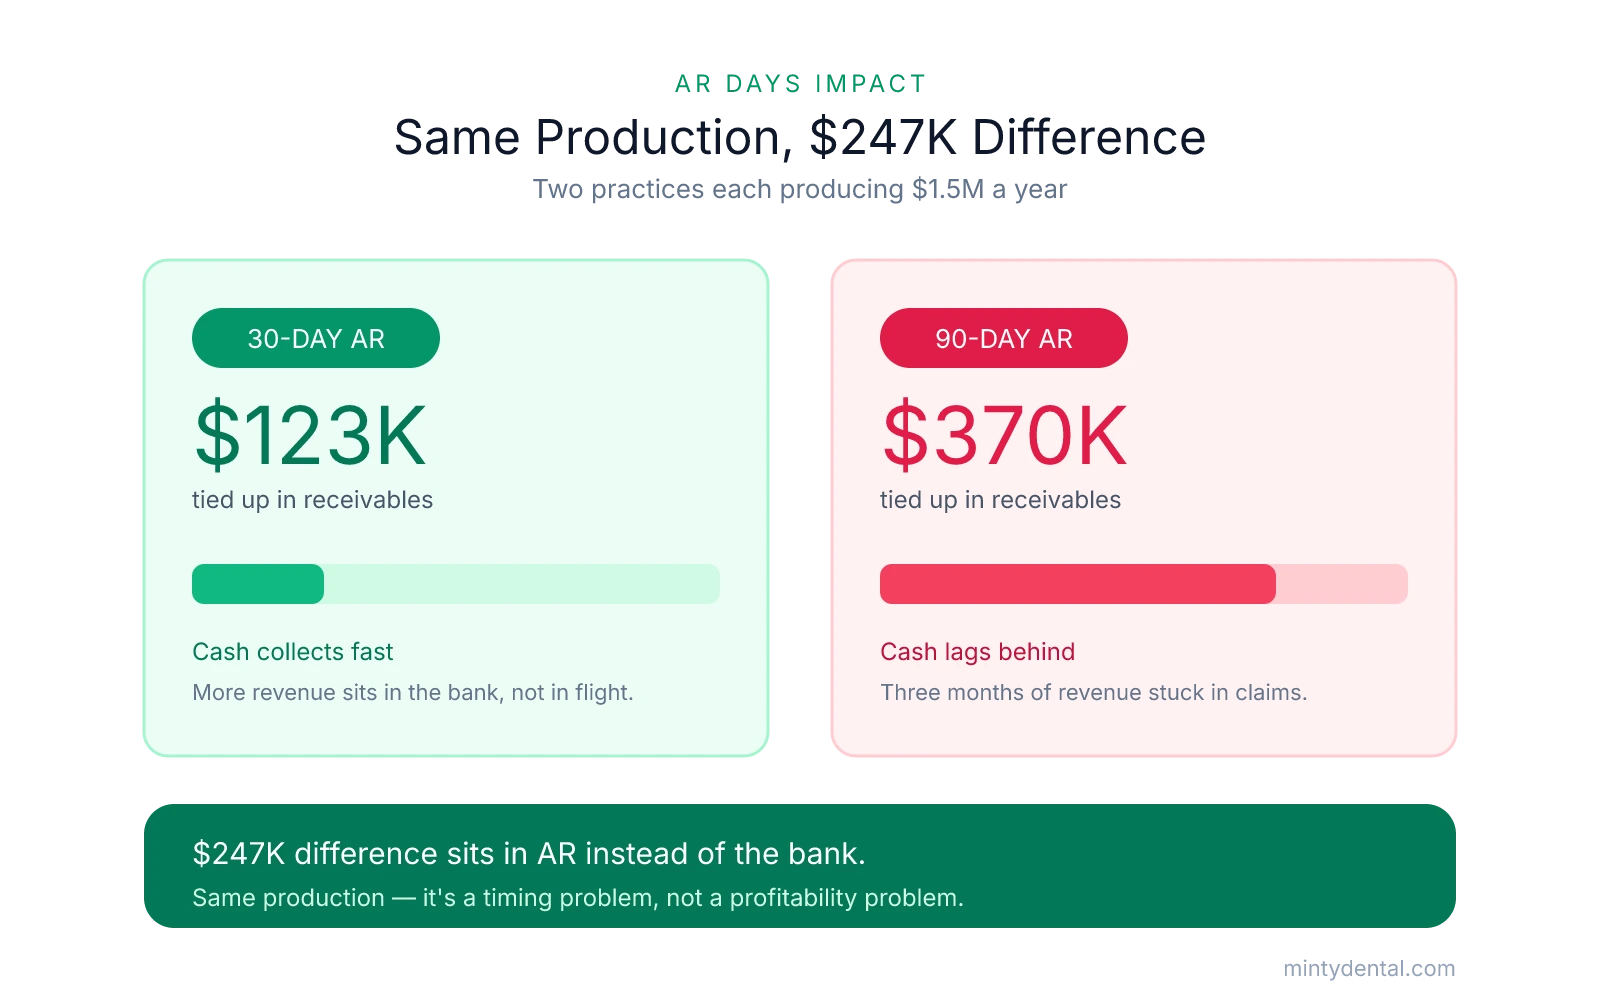
A useful way to measure this is AR days, which represents how long it takes, on average, to collect revenue after it's produced. A practice producing $1.5 million annually with 90-day AR days is carrying roughly $370,000 in outstanding receivables at any given time, compared to about $123,000 for a practice with 30-day AR days on the same production. That's a $247,000 difference sitting in the AR bucket instead of the bank, with both practices producing identical revenue.
This is where a growing practice can feel cash-poor even when the P&L looks healthy. When production increases month over month, AR expands in parallel. More work is being done, more claims are in flight, and collections are lagging behind the production curve. The P&L may show reasonable net income because revenue is being recorded, but the cash hasn't arrived yet. If you're adding a provider or extending hours, this effect gets more pronounced before it gets better.
The operational fix
This is not a profitability problem. The revenue is real and it will eventually collect. It's a timing and workflow problem, and it responds to operational changes. Submitting claims electronically on the date of service rather than batching them shortens the lag from the start. Collecting the estimated patient portion at checkout, before treatment is complete, removes one category of receivables entirely. Running your AR aging report weekly, rather than monthly, lets your team catch denied or stalled claims while they're still workable rather than after they've aged past 90 days. If your collection rate is lower than your production would predict, or if you're seeing a high volume of claim denials slow down reimbursement, those are the specific workflow leaks to address first.
Reading the Cash Flow Statement Alongside Your P&L
Where the P&L answers "did the practice make money?", the cash flow statement answers "where did the cash actually go?" Most accounting platforms, including QuickBooks and Dentrix Ascend, generate it automatically, though most practice owners never pull their cash flow statement.
The statement has three sections. Operating Activities covers the cash generated by running the practice: collections received, payroll paid, supplies, lab fees, rent. This is the closest the cash flow statement gets to your P&L, but it adjusts for timing differences like AR changes. Investing Activities captures equipment purchases and facility buildouts, the one-time cash outlays that show up as small depreciation entries on the P&L while taking large amounts from the bank. Financing Activities covers loan principal payments, new borrowing, and owner draws. Together, these three sections account for every dollar that moved through your bank account in a given period.
The practical value of the statement is that you can use it to reconcile your P&L net income to your actual bank balance change. Using the hypothetical numbers from earlier in this article: start with $40,000 in net income, subtract a $10,000 loan principal payment (Financing), subtract a $20,000 equipment purchase (Investing), subtract a $5,000 owner draw (Financing), and you arrive at a $5,000 actual increase in the bank balance. The gap between what the P&L showed and what the bank holds is now fully explained, line by line. Nothing is missing; it was just sitting in categories the P&L doesn't capture.
That reconciliation is worth running every month, not just at year-end when your accountant is preparing taxes. The monthly habit that protects you is reviewing three reports together: the P&L (profitability), the cash flow statement (where cash went), and the AR aging report (what's still owed and how long it's been outstanding). Each answers a different question, and each catches problems the others miss. If you're only looking at one of them, you're working with an incomplete picture of the practice's financial health, which is where the KPIs most worth tracking every month become most useful.
On the reserve side, financial advisors who work with dental practice owners commonly recommend holding at least three months of operating expenses in a dedicated practice reserve account. That buffer absorbs the timing mismatches covered in this article: insurance payment delays, quarterly tax estimates, a payroll cycle that lands before a major insurance batch clears. Without a reserve, those timing gaps become cash crunches even when the practice is genuinely profitable.
Log into your accounting platform, generate the cash flow statement for the last three months, and set it next to your P&L for the same period. Subtract your Financing Activities (principal payments and owner draws) and Investing Activities (equipment outlays) from your net income. If the result is close to your actual change in bank balance, you now know why the bank looked empty while the P&L looked healthy. If there's still a gap, check the AR aging report next.
Sources & References
The data and claims in this article are drawn from the following sources. We prioritize government data, peer-reviewed research, and established industry publications to ensure accuracy.
- Your Practice in Numbers: Mastering the Profit & Loss Statement— practicecfo.com
- depreciation rules spread the P&L expense over several years— ottenreydentaldental.com
- Quarterly Tax Estimates: Avoid the April Tax Surprise - DSO CFO— dsocfo.comIndustry
- Dental Production vs. Collections: The Gap Explained— reciprocityaccounting.comIndustry
- Dental Accounts Receivable Management: How to Stop Leaking ...— sunrisedentalsolutions.comIndustry
- Dental practice accounting: Why your cash flow statement is critical— www.dentaleconomics.comIndustry
- Essential Financial Planning for Dental Practice Owners: Cash ...— www.highlandplanning.com
Turn P&L Insight Into Real Cash Flow Control
If your books show profit but your account runs dry, the gap lives in billing cycles, debt payments, and capital spending that your P&L never captures. Minty Operations helps independent practice owners track and manage the full cash picture.