Is Your Dental Write-Off Percentage Too High?

Co-Founder, Minty Dental
In Summary
- Your write-off percentage is total adjustments divided by gross production, but that single number blends two completely different problems into one line.
- Contractual write-offs are the discount you agreed to when you signed a PPO contract: unavoidable as long as you're in-network, and addressed through fee schedule strategy.
- Non-contractual write-offs are money you had a right to collect but lost: denied claims nobody appealed, timely filing lapses, courtesy discounts, and patient balances zeroed out to clean up AR.
- Both types post to the same adjustments line in Dentrix, Eaglesoft, and Open Dental, so the blended rate can hide a billing execution problem inside what looks like a routine PPO discount.
- A practice with a 40% blended write-off rate might actually have a 35% contractual rate and a separate $60K non-contractual problem that needs a different fix entirely.
Your Write-Off Percentage Is Two Different Numbers Blended Into One
Your write-off percentage is the ratio of total adjustments to gross production, expressed as a percentage: total adjustments divided by gross production, times 100. On a production report, it looks like one clean fact about your practice. It isn't. It's two separate problems averaged together, and treating it as a single number is why a lot of owners either panic over a rate that's mostly contractual or miss a real billing problem hiding behind it.
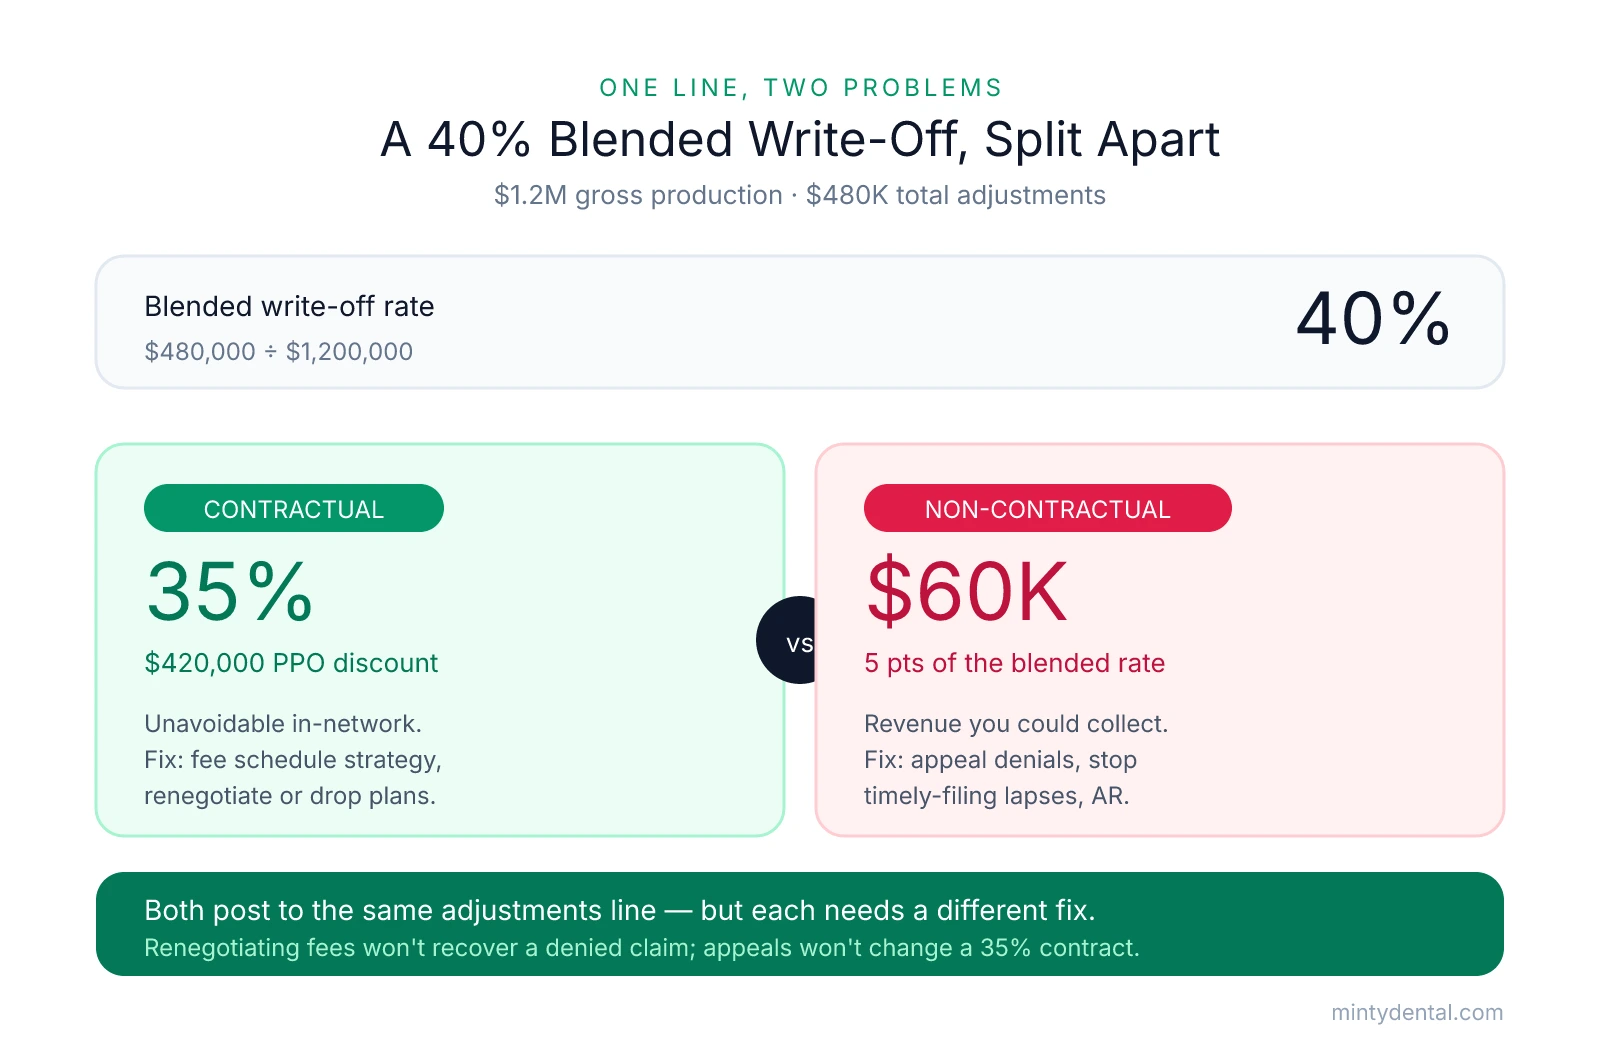
The first component is contractual write-offs: the difference between your full fee and the amount a PPO allows for a given procedure. When you signed the contract, you agreed to accept the plan's allowed amount instead of your full fee, so this discount posts automatically on every in-network claim. Most dentists now participate in at least one PPO network, which is why contractual write-offs have become a permanent fixture on the dental P&L. These adjustments aren't a failure; they're the predetermined cost of that patient relationship. You can influence them by renegotiating fees or reconsidering which plans you participate in, but as long as you're in-network, you can't eliminate them.
The second component is non-contractual write-offs: money you were entitled to collect and lost anyway. Denied claims that nobody appealed. Timely filing lapses where the window closed before the claim went out. Courtesy discounts handed out at checkout. Secondary claims that were never submitted. Patient balances zeroed out to close an aging account. These aren't the cost of participating in insurance; they're revenue that left through gaps in claims workflow and front-desk decisions.
The practical problem is that both types post to the same adjustments line. In Dentrix, Eaglesoft, and Open Dental, a $180 contractual discount and a $180 balance written off to clear a patient ledger can carry identical descriptions. The blended rate treats them as equivalent when they're not even close.
Here's a concrete example. A practice produces $1.2 million gross and carries $480,000 in total adjustments: a 40% blended write-off rate. If $60,000 of those adjustments are non-contractual, the actual PPO contractual discount rate is $420,000 divided by $1,200,000, or 35%. The remaining $60,000 represents a billing and collections execution problem, not a fee schedule problem. Both require action, but the action for each is completely different. Renegotiating a fee schedule doesn't recover a denied claim that lapsed. Appealing claims doesn't address a PPO contract paying at 35%.
That separation is the entire foundation of diagnosing your write-off rate. If your practice is experiencing a low collection rate alongside high adjustments, it's worth determining how much of each is contractual before drawing any conclusions about where the problem actually lives.
How to Calculate Your Write-Off Rate by Plan (Not Just Practice-Wide)
The blended practice total is where you notice a problem. The per-plan breakdown is where you find it.
Every major PMS gives you a way to get there. In Dentrix, run the Insurance Adjustment report and filter by carrier or plan. Eaglesoft has an Insurance Analysis report that breaks adjustments out by plan. Open Dental's adjustment report lets you filter by insurance plan and adjustment type. What you're looking for is two numbers for each plan: contractual adjustments posted and gross production billed:
Contractual adjustments for Plan X divided by gross production billed to Plan X, times 100.
Run that for every PPO you participate in, and you'll almost certainly find the rates aren't uniform. One plan might be writing off 24% while another is writing off 44%. The blended average tells you nothing about which contract is the actual problem.
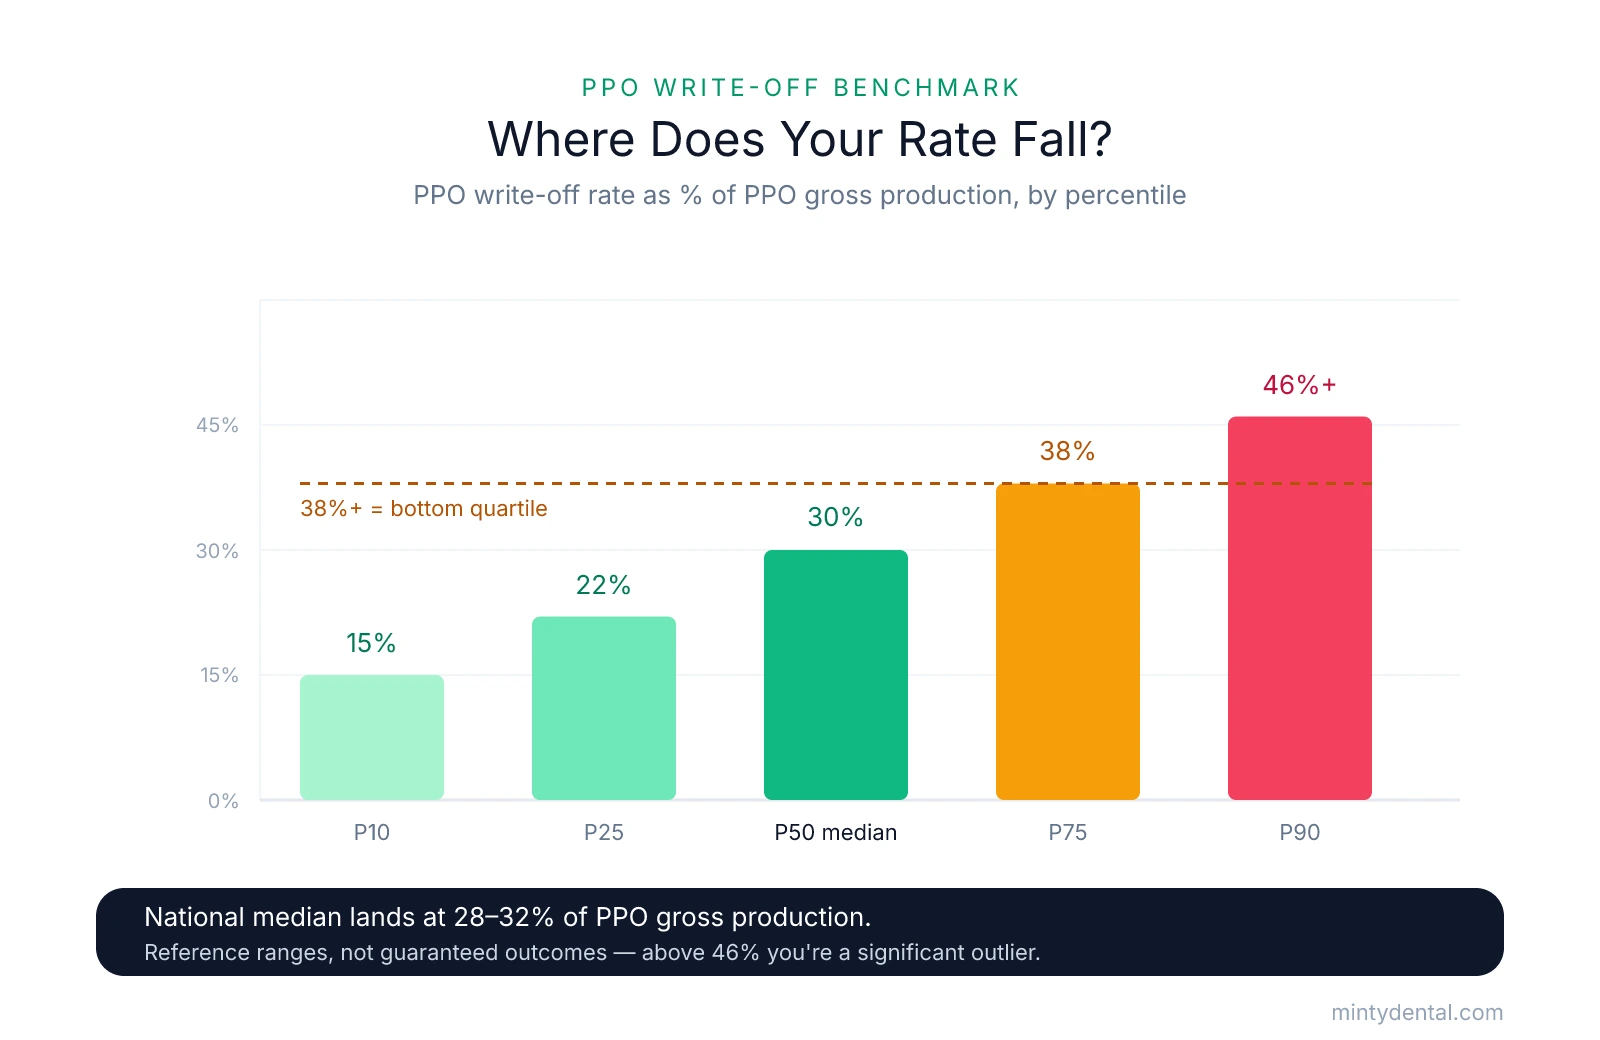
Once you have per-plan rates, you need something to compare them to. The national median for general dental practices sits around 28 to 32% of PPO gross production. Here's how that looks across the distribution:
| Percentile | PPO Write-Off Rate |
|---|---|
| P10 | 15% |
| P25 | 22% |
| P50 (median) | 30% |
| P75 | 38% |
| P90 | 46%+ |
Industry benchmark data. Label these as reference ranges, not guaranteed outcomes for any individual practice.
A write-off rate at or above 38% puts you in the bottom quartile of PPO economics. Above 46%, you're a significant outlier by any measure. Metro practices in highly competitive markets can approach 50% and still be functioning, but context matters as much as the number. A 45% write-off with open chair time and high fixed overhead can be rational; a 32% write-off at a practice turning away fee-for-service patients to honor a bad contract is a slow bleed. The rate is a symptom. The chair utilization and payer mix context is the diagnosis.
One thing the per-plan analysis won't automatically surface is passive drift. Your office fees likely increase each year with inflation and supply costs, but PPO fee schedules often stay flat or get cut. The gap between billed fees and insurance reimbursement widened across nearly every procedure studied from 2005 to 2014, and that trend has continued. A plan that wrote off at 30% three years ago can quietly drift to 36% without a single contract change, just because your fees moved and theirs didn't. This is worth checking when you pull the per-plan data: compare this year's rate to last year's on the same plan.
The other hidden driver is leased network arrangements, sometimes called silent PPOs. A third-party payer you have no direct contract with can access your contracted rate through a network leasing arrangement and apply it to their own claims, sometimes at a deeper discount than your original agreement. If you're seeing adjustments post for a carrier you don't recognize, or your effective rate on certain claims is lower than the plan contract specifies, a leased network arrangement may be pulling your per-plan rate down without your direct knowledge. It won't show up under the right plan name in your adjustment report, which is one reason per-plan analysis is worth doing alongside a review of which payers are actually submitting claims.
What a High Write-Off Rate Actually Means for Your Collections
The write-off percentage becomes real money the moment you attach it to production volume. Take a hypothetical practice producing $1.5 million gross annually, with 65% of that production billed to PPO patients ($975,000) and a 42% write-off rate on that PPO volume. The math: $975,000 multiplied by 58% collected nets roughly $565,500 from those patients. If that same clinical volume came from fee-for-service patients paying full fee, the practice would collect the full $975,000. The gap, about $410,000, is the annual cost of the fee schedule discount before a single overhead dollar gets counted. These are illustrative numbers, not benchmarks, but the structure of the calculation is exactly what your own PMS data will produce when you run it by plan.
That dollar figure matters because overhead doesn't care about your gross production — it's measured against collections. Rent, payroll, and supply costs are fixed or semi-fixed regardless of what your production report says. So a practice writing off 42% of PPO production has to generate substantially more gross to cover the same expenses as a practice writing off 28%. Put another way: two practices with identical overhead structures and identical chair hours can have meaningfully different financial results simply because one carries heavier contractual discounts. Across the industry, private insurance reimbursement averaged only 66.4 to 81.1% of submitted fees depending on procedure category — implying a 19 to 34% write-off at the procedure level even before practice-level factors like payer mix. And that gap widened from 2005 to 2014, meaning the overhead math has gotten harder over time, not easier.
It's worth separating this from net collection rate, because they measure different things. A practice can write off a large contractual amount and still collect 98% of what it's actually owed — that's a high net collection rate alongside a high write-off rate. No billing leakage, good follow-through, clean claims. The write-off rate doesn't diagnose how well the practice collects; it diagnoses how much revenue remains after the fee schedule discount. If you're seeing collection rate problems alongside high write-offs, those are two separate issues layered on top of each other.
The payer mix connection ties this together. The national median sits around 65% PPO production and 20% fee-for-service, and practices in the top financial quartile tend to run 30 to 45% fee-for-service. That's not coincidental. Each chair hour at a 42% write-off rate produces meaningfully less net revenue than the same hour spent with a fee-for-service patient. High overhead percentages in heavily PPO-dependent practices often aren't a cost problem; they're a revenue-per-chair-hour problem created by the discount structure. The write-off rate is the clearest lens for seeing it.
Deciding What to Do When Your Write-Off Rate Is Out of Range
The split between contractual and non-contractual adjustments determines which problem you're actually solving.
If your per-plan analysis turns up a meaningful non-contractual number, the fix lives in claims workflow, not fee schedules. That means establishing a written policy that requires a reason code and supervisor sign-off before any balance gets written off. It means appealing denied claims before closing them, because a denial is not a final answer. It means auditing the adjustment codes your team is using, because courtesy discounts and balance forgiveness sometimes get coded as contractual adjustments, which inflates your apparent PPO write-off rate and masks the real problem. If your practice's claim denial rate is running above 10%, there's money sitting in those denials that a systematic appeal process can recover.
For contractual write-offs that are genuinely high, you have three realistic paths.
Renegotiate the fee schedule. This is where most practices should start before anything else. Start by identifying which procedure codes generate the highest total revenue for your practice, knowing your current allowed amounts on each, and contacting the carrier's provider relations representative with a written request. Your leverage depends on local market factors: how many participating dentists are in your area, your wait times, and how long it's been since your fees were last revised. A practice in a low-supply area has more room to push than one in a dense metro. For step-by-step guidance on making that case without walking away from the plan, renegotiating PPO fees without dropping is worth working through before you pick up the phone.
Drop the plan if the math supports it. Industry data suggests 60 to 70% of patients typically stay with the practice after a plan is dropped, paying out-of-network or at full fee. Run the scenario before deciding: take the plan's annual gross production, apply the retention estimate, multiply by your full fee collected, and compare that to what you're currently netting after write-offs. For many plans sitting above 40%, the net revenue holds or improves even at 65% retention. The analysis matters because the answer isn't the same for every plan.
Shift payer mix over time. If you're carrying open chair time, dropping a high-write-off plan immediately trades a discounted chair hour for an empty one, which is worse in the short term. The more rational path is growing fee-for-service volume to fill capacity first, then reconsidering participation as that volume builds. A practice that's fully booked and turning away fee-for-service patients to honor a 44% write-off contract is making a different calculation than one with 20% open chair time. For practices thinking through that transition deliberately, sequencing a PPO-to-FFS shift covers how to manage it without a revenue cliff.
Once you have your per-plan write-off rates from this month's adjustment report, rank the results by annual dollar impact, not just percentage. The plan with the worst combination of high write-off rate and high production volume is where your analysis starts, because that's where fee schedule improvement or a drop decision moves the most actual dollars.
Sources & References
The data and claims in this article are drawn from the following sources. We prioritize government data, peer-reviewed research, and established industry publications to ensure accuracy.
- [PDF] Q2 2026 State of US Dental Economy— ada.orgIndustry
- Write-offs at the dental office: do's and don'ts of writing off payments— www.dentalclaimsupport.comIndustry
- PPO Write-Off Rate Dental Benchmarks | DSI— dentalstrategyinstitute.comIndustry
- PPO Write-Off Percentage: When Is It Too High? - The Dental Signal— www.thedentalsignal.comIndustry
- [PDF] Q2 2026 State of US Dental Economy— ada.orgIndustry
- [PDF] Q2 2026 State of US Dental Economy— ada.orgIndustry
See Where Your Crown Fee Stands Before Renegotiating
If your write-off analysis points to a fee schedule problem, the next step is knowing what your PPO rates look like compared to your area and whether a group fee schedule could change the math. Run a quick check on your crown fee to get that picture.