How to Analyze Your Dental Payer Mix by Insurance Plan

Co-Founder, Minty Dental
In Summary
- Payer mix is the percentage of gross production attributable to each carrier, including fee-for-service and self-pay patients, not simply a headcount by plan.
- Aggregate production and collection reports can hide the fact that one or two PPO plans are responsible for the majority of your write-offs.
- Two reports in your practice management software, the Insurance Carrier Production Report and the PPO Write-Offs Report, give you the carrier-level data needed to identify underperforming plans.
- ADA research found that third-party reimbursement averaged only 66.4 to 81.1% of submitted fees by procedure, with the gap widening over time.
- Nearly 60% of dentists reported stagnant reimbursement rates in an ADA poll, even as overhead costs rose across supplies, staffing, and lab fees.
Payer Mix Analysis Identifies Which Plans Are Suppressing Your Net Collections
Payer mix is the percentage of your gross production attributable to each insurance carrier, plus the share coming from fee-for-service and self-pay patients. It is not a patient count. Two plans can each account for 200 patients and still look nothing alike when you measure what they actually contribute to collections.
That distinction matters because the standard reports most owners review, total production and total collections for a given period, give you a practice-wide number with no plan-level detail underneath it. If your practice produced $1.2M last year and collected $840K, you know there is a $360K gap. What you do not know is whether that gap is spread more or less evenly across your plans, or whether one or two carriers are responsible for most of it while the others perform reasonably well. Without that breakdown, you are managing the average, not the problem.
Two reports in your practice management software make the carrier-level analysis possible. The Insurance Carrier Production Report, available in Dentrix, Eaglesoft, and Open Dental, shows production billed to each carrier alongside insurance payments received, broken out by primary and secondary coverage. That gives you the numerator and denominator for a basic net reimbursement rate per plan. The second report is the PPO Write-Offs or Contractual Adjustments Report, labeled differently depending on your software. This one isolates the contractual adjustments posted against each carrier so you can see how much production you are discounting away on a plan-by-plan basis rather than as a practice-wide total. Used together, these two reports turn an opaque collections gap into a carrier-specific problem you can actually act on.
The urgency of doing this analysis has grown considerably over the past decade. Third-party reimbursement averaged only 66.4 to 81.1% of submitted fees by procedure category, with the gap between submitted fees and paid amounts widening from 2005 to 2014. And the trajectory since then has not improved: nearly 60% of dentists reported stagnant reimbursement rates, even as overhead climbed across supplies, staffing, and lab fees. Understanding whether your overall write-off rate is within a reasonable range is a useful starting point, but the more precise question is which carriers are pulling that number up.
Building the Per-Plan Table: Production, Write-Offs, and Net Reimbursement Rate
Start with your Insurance Carrier Production Report pulled for a full 12-month period. Filter out any carrier representing less than 1% of total gross production — those belong in an "Other PPO" bucket for now. What you are left with is the core group of plans that actually shape your collections.
For each carrier, you need four numbers: gross production billed, contractual adjustments posted, net collections received, and active patient count on that plan. From those four numbers, you can calculate everything else.
To calculate the mix percentage for each carrier, divide carrier gross production by total gross production and multiply by 100. This tells you how dependent your practice is on each plan, not by headcount but by revenue weight.
Next, calculate the write-off rate percentage by dividing contractual adjustments by carrier gross production and multiplying by 100. At the national median, general dental practices write off approximately 28 to 32% of PPO gross production to contractual adjustments. Practices at the 75th percentile are writing off 38% or more, meaning they are in the bottom quarter of PPO economics by this measure.
Finally, find the net reimbursement per patient by dividing net collections from that carrier by the active patient count on the plan. This number tends to surprise owners, because a plan with many patients can still deliver less revenue per chair hour than a smaller plan with better rates.
Here is a hypothetical example. All numbers are illustrative.
| Carrier | Gross Production | Mix % | Contractual Adjustments | Write-Off Rate % | Net Collections | Active Patients | Net per Patient |
|---|---|---|---|---|---|---|---|
| Plan A | $40,000 | 40% | $8,800 | 22% | $31,200 | 180 | $173 |
| Plan B | $30,000 | 30% | $13,200 | 44% | $16,800 | 190 | $88 |
| Plan C | $20,000 | 20% | $5,000 | 25% | $15,000 | 95 | $158 |
| FFS / Self-Pay | $10,000 | 10% | $0 | 0% | $10,000 | 40 | $250 |
| Total | $100,000 | 100% | $27,000 | 27% | $73,000 |
Reading the Table: Patterns That Signal a Revenue Problem
The per-plan table surfaces distinct problems that require different responses, and conflating them leads to the wrong diagnosis.
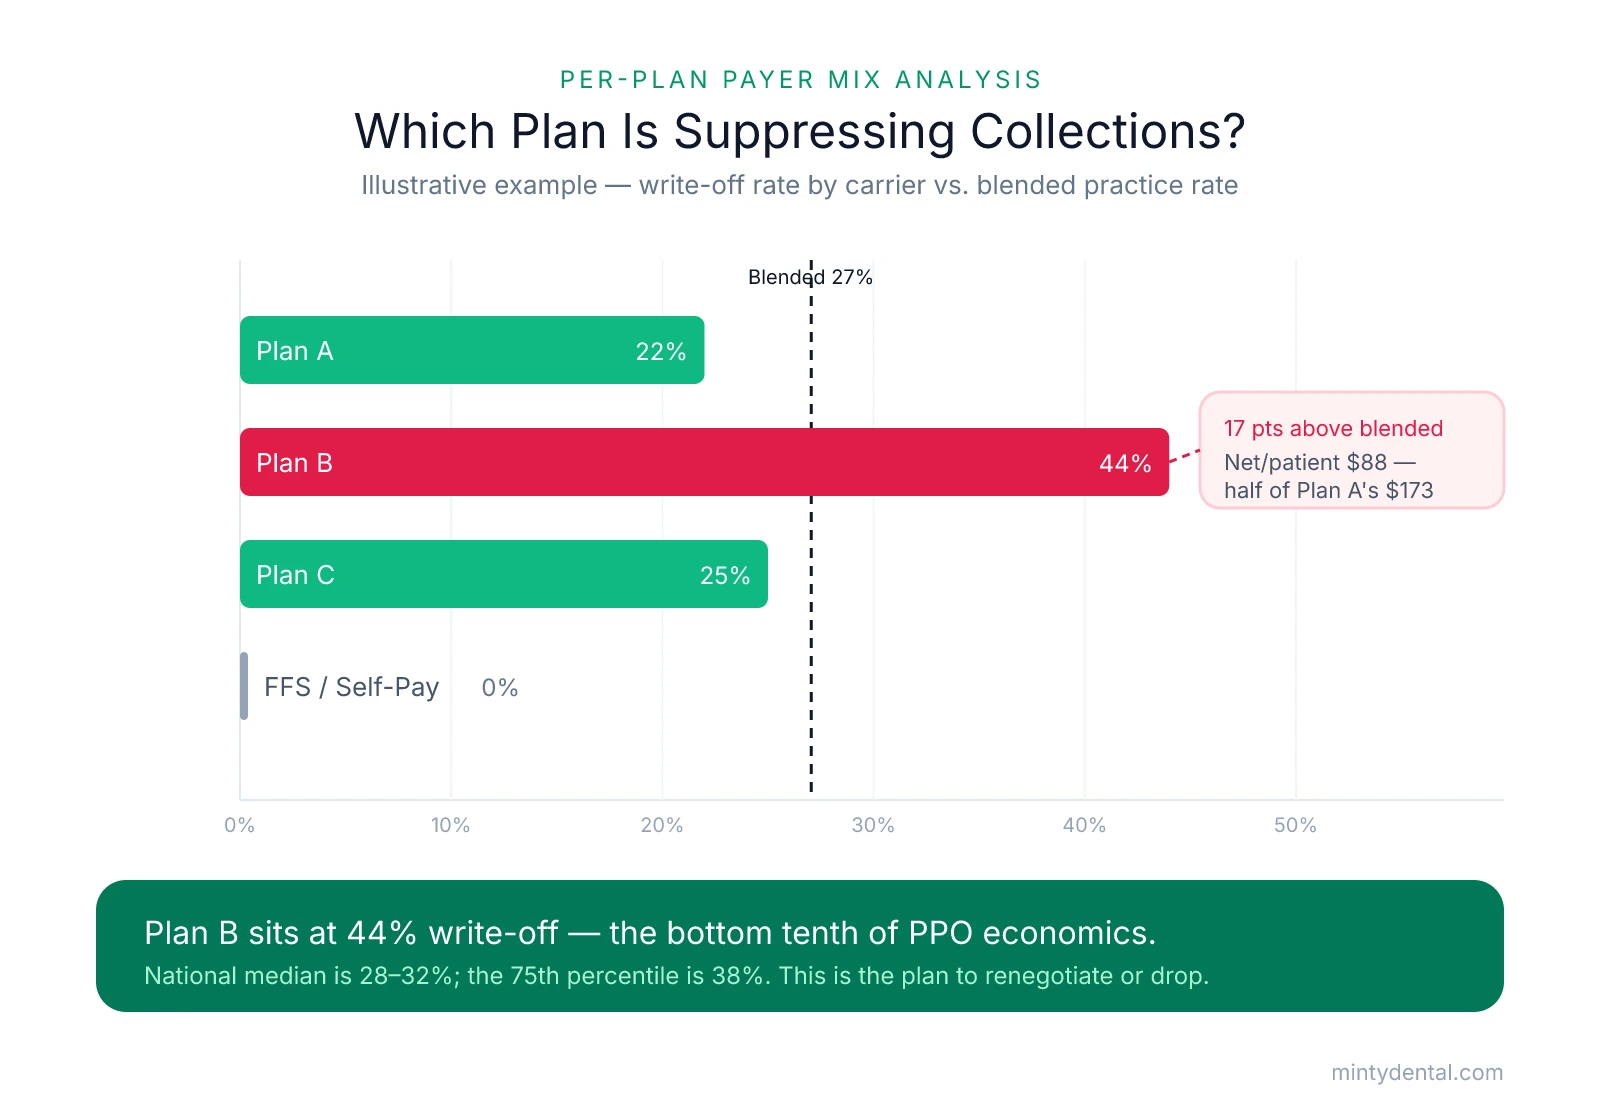
The first issue to look for is a disproportionate write-off rate, which means the contracted fee schedule is pulling well below your usual and customary fees. Plan B is the problem this table is designed to surface. It has more active patients than Plan A, generates meaningful gross production, and probably looks fine in an aggregate report. However, its 44% write-off rate sits 17 percentage points above the practice's overall blended rate of 27% — and with the national median write-off rate at 28 to 32% and the 75th percentile at 38%, a plan at 44% is in the bottom tenth of PPO economics by that measure. Its net reimbursement per patient ($88) is also roughly half of Plan A's ($173). When a plan like Plan B carries a large patient count, the chair-time cost compounds: the practice is running full schedules for that carrier at a steep discount relative to nearly every other payer in the mix, discounting nearly half the production away before collecting anything.
High concentration in a single plan is a different kind of risk, even when that plan's fee schedule looks acceptable. In the hypothetical above, Plan A has a genuinely good 22% write-off rate, but it also represents 40% of total gross production. If that carrier cuts rates, delays credentialing, narrows its network, or exits the market, the practice absorbs a major revenue disruption with little buffer from other plans. Industry data puts the median top-payer concentration between 35 and 42%, while anything above 55% is a meaningful risk flag. Because concentration risk sets in well before 50%, a single plan at 40 to 45% of production deserves scrutiny on concentration grounds alone, separate from whatever its write-off rate happens to be.
The write-off rate column will not catch everything, though, which is why you also need to watch for a subtler third pattern in the rightmost column. Sometimes a plan shows a low write-off rate but still delivers weak net reimbursement per patient. If a carrier's patients tend to use only preventive benefits and rarely accept or complete restorative treatment, the plan is not suppressing your per-procedure rate; it is limiting the scope of billable work. The plan looks fine until you divide net collections by active patient count and see that those patients are generating far less revenue per visit than patients on other plans.
Tracking this table as one of your monthly practice KPIs puts you in a position to catch these problems early, before a marginal plan has quietly absorbed another year of chair time.
One more thing worth checking if any carrier's write-off rate looks unexpectedly worse than you anticipated: leased network arrangements. Some carriers route claims through networks the practice never directly contracted with, applying fee schedules from those third-party networks at rates lower than the practice's direct contract would imply. If a plan's write-off rate is noticeably worse than what your contract paperwork would predict, that is worth investigating before you draw conclusions about whether the plan itself is the problem.
Using the Analysis to Decide: Renegotiate, Drop, or Accept
For each underperforming plan, you have three options: renegotiate the fee schedule, drop the plan, or accept the current terms. The right answer for each plan depends on its write-off rate, patient volume, concentration in your mix, and the competitive reality of your local market.
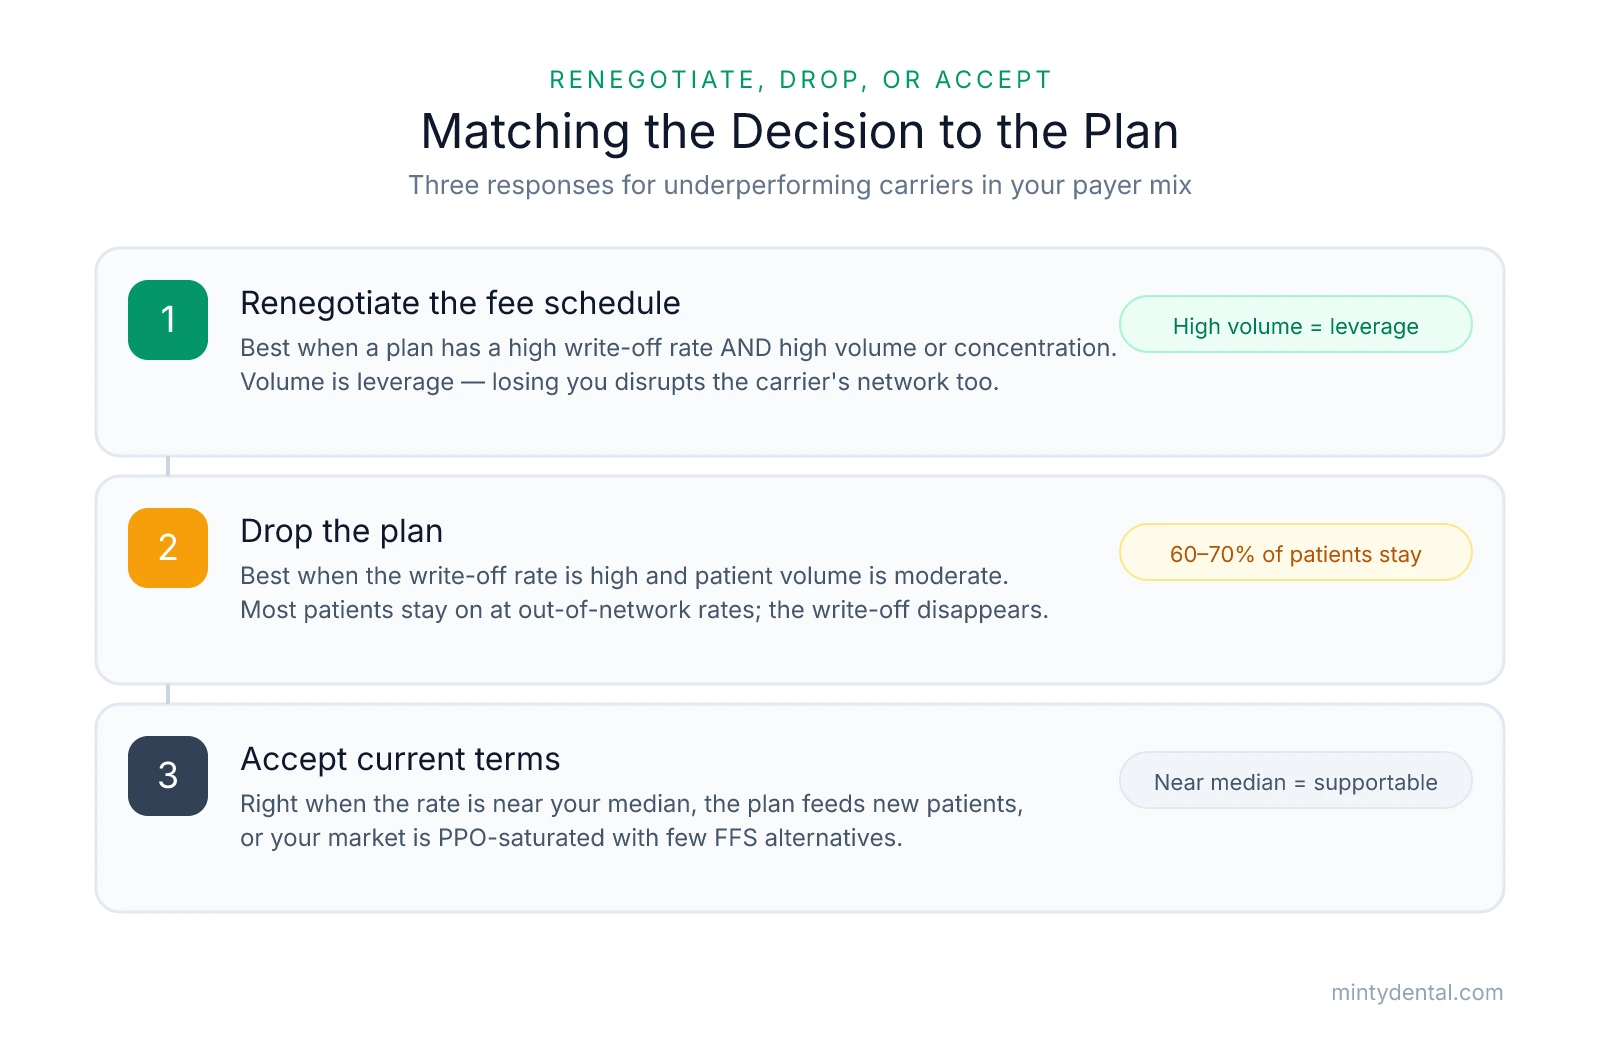
Renegotiation makes the most sense when a plan has a high write-off rate but also high volume or significant concentration in your production mix. Volume is leverage. If your practice represents a large block of patients in a carrier's local network, terminating your participation is a meaningful disruption for them too. Carriers are more likely to move on rates when the alternative is losing access to an active, well-credentialed practice with hundreds of their enrolled members. The process for making that case is worth understanding before you send a termination letter, since a credible renegotiation attempt often produces a rate adjustment that a letter asking nicely does not. That approach is covered in detail in how to renegotiate PPO fees without dropping the plan.
Dropping a plan becomes the better option when the write-off rate is high and patient volume is moderate rather than dominant. The economics tend to work because most patients on a dropped plan do not leave the practice. After a plan is dropped, an estimated 60 to 70% of patients typically stay with the practice at out-of-network rates, which means the write-off on the retained portion disappears while most of the revenue stays. The key variable is your specific attrition threshold: how many patients can leave before the revenue loss from attrition outpaces the gain from eliminating the write-off on those who stay? That number is specific to your practice's production per patient, variable costs, and new-patient replacement capacity. Worth noting: renegotiation and dropping a plan are not mutually exclusive. You can submit a renegotiation request, give the carrier a defined window to respond, and drop only if they decline to move. That sequence preserves the relationship while making clear the alternative is real.
Accepting current terms is the right call when a plan's write-off rate is near your practice median, the plan is a consistent source of new patients, or your market is heavily PPO-saturated with limited fee-for-service alternatives. Acceptance is not a failure of analysis. It is a conclusion that the current terms are supportable given what the plan contributes to patient flow and production.
The table also works in the other direction. Plans with low write-off rates and strong case acceptance are assets worth protecting, and sometimes worth actively marketing toward. A plan at 20% write-off with solid restorative acceptance is generating meaningfully more net revenue per chair hour than your median PPO. That is worth knowing when you are making staffing decisions, thinking about network participation in a new service area, or considering whether a full PPO-to-FFS transition makes sense for your practice.
Finally, this analysis works poorly as a one-time exercise. Fee schedules change, usually without announcement. Patient mix shifts as your neighborhood demographics evolve or as a large employer in your area changes insurance carriers. A plan that sat at a 25% write-off rate two years ago may now be your worst performer, and you will not know that until you rebuild the table. Running it quarterly and comparing it against prior periods is what turns payer mix analysis from a diagnostic exercise into an ongoing management tool.
Sources & References
The data and claims in this article are drawn from the following sources. We prioritize government data, peer-reviewed research, and established industry publications to ensure accuracy.
- Getting to know the Insurance Carrier Production Report— blog.dentrixenterprise.comIndustry
- ADA Guidance on Coordination of Benefits— ada.orgIndustry
- Payer reimbursements stagnant for nearly 60% of dentists despite ...— beckersdental.comNews
- PPO Write-Off Rate Dental Benchmarks | DSI— www.dentalstrategyinstitute.comIndustry
- How to Evaluate Your Payor Mix Percentage— pponegotiationsolutions.comIndustry
- PPO Drop Economics (2026): The Real Net-Revenue Model— dentalpracticeinsider.orgIndustry
See Where Your PPO Fees Stand by Area
Now that you know which plans to scrutinize, a Rate Check can show you how your current fees compare in your market and whether a group fee schedule could change the math on any of them.