Dental Practice AR Aging Report: What's Normal When Buying

Co-Founder, Minty Dental

The AR Aging Report Reveals Collection Health That the P&L Cannot
An accounts receivable aging report is a financial snapshot that categorizes all outstanding practice revenue by how long it has remained unpaid. Practice management software sorts every open balance into four standard buckets: 0-30, 31-60, 61-90, and 91-plus days. Each line typically shows the patient, the responsible party, the service date, the original billed amount, and the current outstanding balance, which lets you see at a glance which money is fresh and likely to be collected versus which has grown stale.
Most systems present the report in two views, and they age for different reasons. Insurance aging tracks claims a practice has submitted to carriers but has not yet been paid, so these balances move on carrier processing timelines. Patient aging shows what patients owe after insurance has processed, including copays, deductibles, and non-covered services, which depend on the practice's statement and collection habits. Because chasing a slow carrier requires different tactics than collecting from patients, the two views are worth evaluating separately.
The P&L cannot answer the questions this report answers. A profit and loss statement reflects cash the practice actually collected, not the quality of the billing system behind it or the recoverability of what remains outstanding. Two practices with identical collections can carry very different AR profiles, and only the aging report shows that difference. For a fuller picture, many buyers read the aging report alongside the collections and adjustment lines on the P&L.
The core question a buyer is working to answer is whether the profile in front of them reflects a normal lag in billing cycles or evidence of a collection system that will underperform under new ownership. Because a single report captures only one moment, it should be compared with other reporting periods rather than read in isolation.
Benchmark Numbers for Each Aging Bucket — and What Deviations Signal
Bucket benchmarks work best as diagnostic starting points rather than pass or fail grades, because payer mix, specialty, and billing cycles all shift what a healthy distribution looks like.
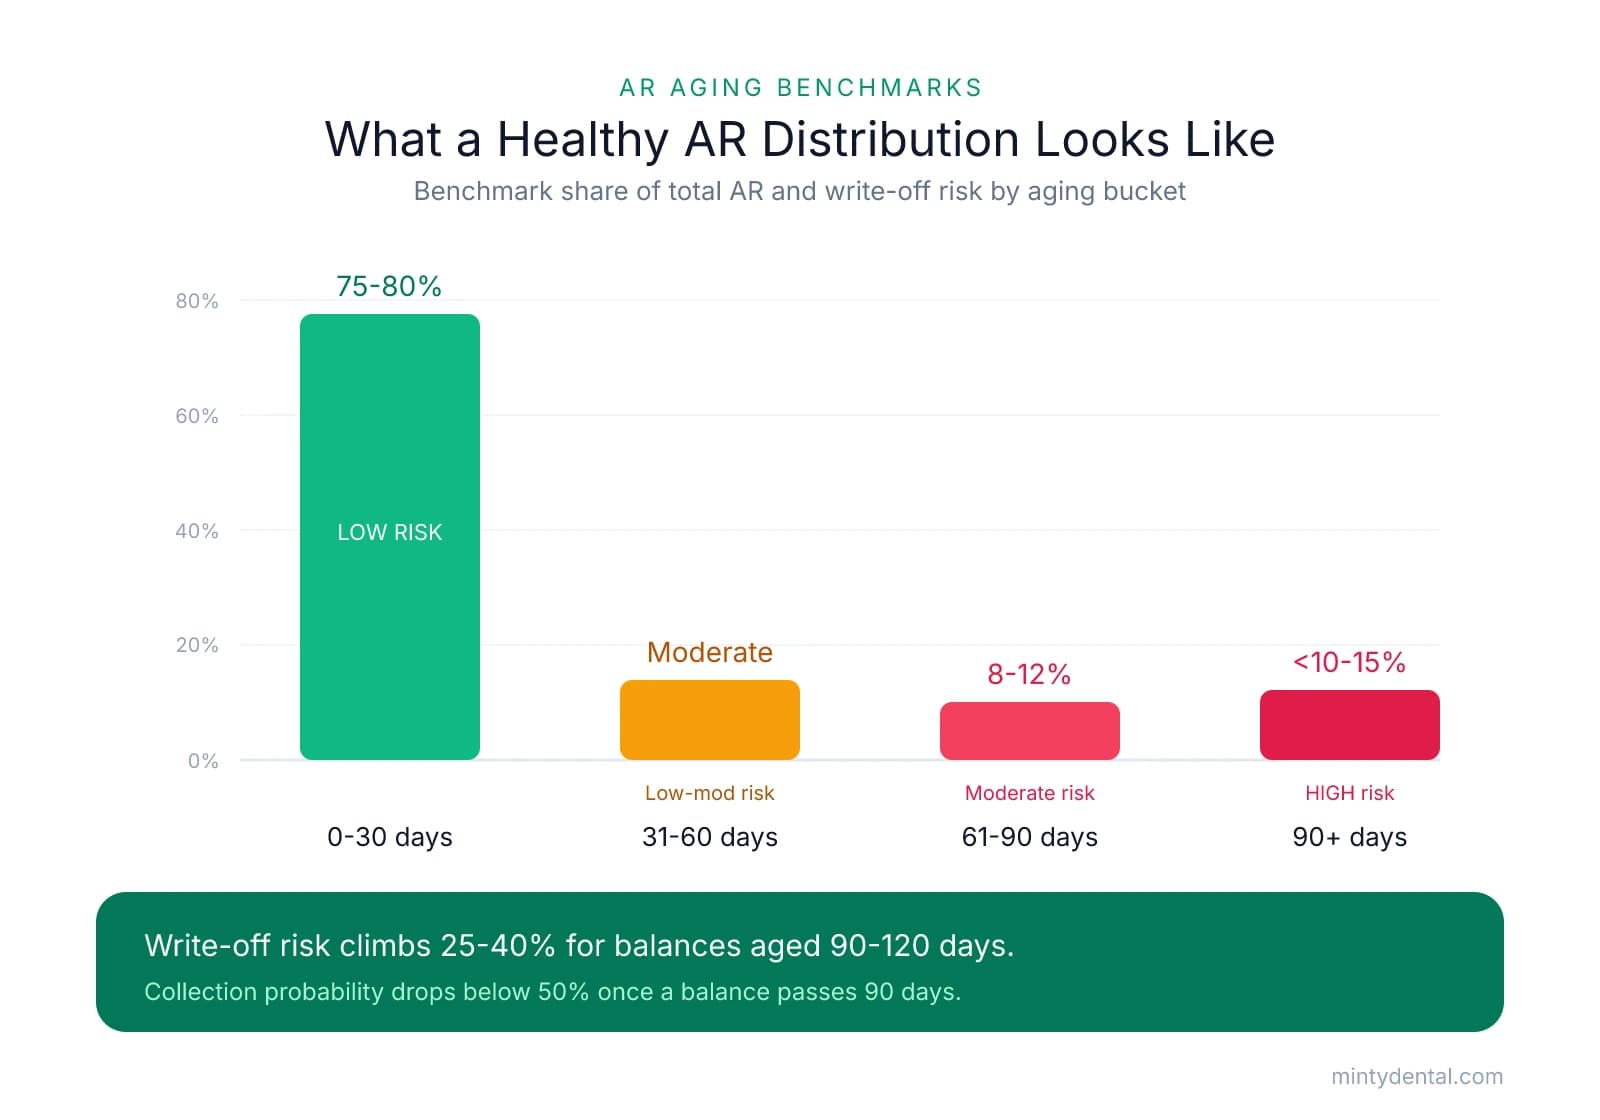
The four buckets each carry a different level of collection risk, and the write-off exposure rises sharply as balances age.
| Aging Bucket | Benchmark Share of Total AR | Write-Off Risk | What a Deviation Suggests |
|---|---|---|---|
| 0-30 days | 75-80% | Low | Normal billing lag for claims and statements |
| 31-60 days | Moderate | Low to moderate (8-12% at 61-90 begins nearby) | Claims initially rejected and being refiled, common in insurance-heavy practices |
| 61-90 days | Small | Moderate | Delayed follow-up or disputes without resolution |
| 90+ days | Under 10-15% | High (25-40% in the 90-120 day range) | Largely uncollectable balances, often never written off |
The 0-30 day bucket should hold the majority of total AR because it reflects the routine gap between billing and payment. As balances move into 31-60 days, a moderate amount is expected in practices with heavy insurance volume, since carriers frequently reject first submissions that then require correction and refiling. The 61-90 day range functions as a warning zone: balances sitting here suggest that follow-up is lagging or that claims are being disputed without being resolved. Past 90 days, collection probability drops below 50%, and write-off rates in the 90-120 day range run 25 to 40 percent.
Two ratios summarize the report quickly.
- AR-to-monthly-production ratio: Divide total AR by average monthly production. A ratio of 1.0 or below indicates AR is roughly one month of production or less. A ratio of 1.5 or higher points to systemic collection problems worth investigating before closing.
- Percentage of AR over 90 days: Divide the 90+ balance by total AR. A result under 10-15% is consistent with healthcare benchmarks; figures above that range signal elevated write-off exposure.
For context on collection timing, practices are generally expected to collect roughly 90% of fees within 30 days and the remaining 10% within 60 days, and falling short of that pace is a reasonable trigger to examine the collection system.
Many sellers never formally write off uncollectable 90+ day balances, so the reported AR total may overstate what is actually recoverable. Asking how frequently the seller writes off bad debt, and reviewing the most recent write-off entries, helps you gauge how much of the aged balance is real. Practices with a large PPO share tend to carry more insurance aging, which connects to how payer mix shapes collectability and financing.
How to Evaluate the AR Report as a Buyer: A Practical Framework
Use the AR report to judge whether the profile reflects a fixable front-office issue or a structural problem in the patient base or payer mix.
Step 1: Request multiple reports over time. Ask for at least two to three aging reports pulled roughly three months apart. A well-run billing system produces stable profiles month to month. A profile that drifts steadily older across reports suggests follow-up is falling behind and the practice may be heading into collection trouble under current ownership.
Step 2: Separate insurance AR from patient AR and evaluate each independently. Insurance-heavy practices naturally carry more 0-30 day balances because carrier processing takes time, so a large current-bucket insurance balance is often routine. High patient AR in the 60-90+ range is a stronger warning sign, since it reflects the practice's own statement and collection habits rather than a carrier's timeline.
Step 3: Cross-reference the AR profile against the net collection rate. A bloated AR profile paired with a strong collection rate can indicate a temporary billing lag. A practice with a ratio above 1.0 and a net collection rate below 95% is showing compounding collection problems, because money is both aging and not ultimately arriving.
Step 4: Ask the seller specific questions. How often are uncollectable balances written off? What does the insurance follow-up process look like week to week? Are any large individual balances in dispute or already with a collections agency? These answers reveal whether the aged balance is real or inflated, and inconsistencies here often warrant a closer chart and billing audit.
Step 5: Check for patient credits. Patient credits are overpayments the practice owes back to patients, and they are a liability rather than an asset. Quantify them before closing, because they may transfer to you.
Orthodontic and oral surgery practices often carry higher AR ratios because of payment plan structures, so evaluate them against specialty-appropriate norms. Where the findings point to real weaknesses, they can support a price adjustment or revised AR terms in the agreement.
Handling AR in the Purchase Agreement: Buy It, Leave It, or Collect for a Fee
Accounts receivable are negotiated separately from the purchase price as their own item, so buyers benefit from addressing AR treatment in the letter of intent before due diligence begins rather than after a valuation is already in motion.
Three standard approaches cover most deals:
- Seller retains and collects independently. The seller keeps the AR and pursues it after closing. This avoids valuation complexity, but it requires a clear post-closing protocol so both parties know how payments will be handled.
- Buyer purchases the AR at a discount. The buyer takes ownership of the portfolio at a value reduced by aging, giving the new owner an early cash flow stream.
- Buyer collects on the seller's behalf for a fee. The buyer's front desk works the AR and remits collections to the seller, keeping a negotiated fee, typically around 5% of amounts collected.
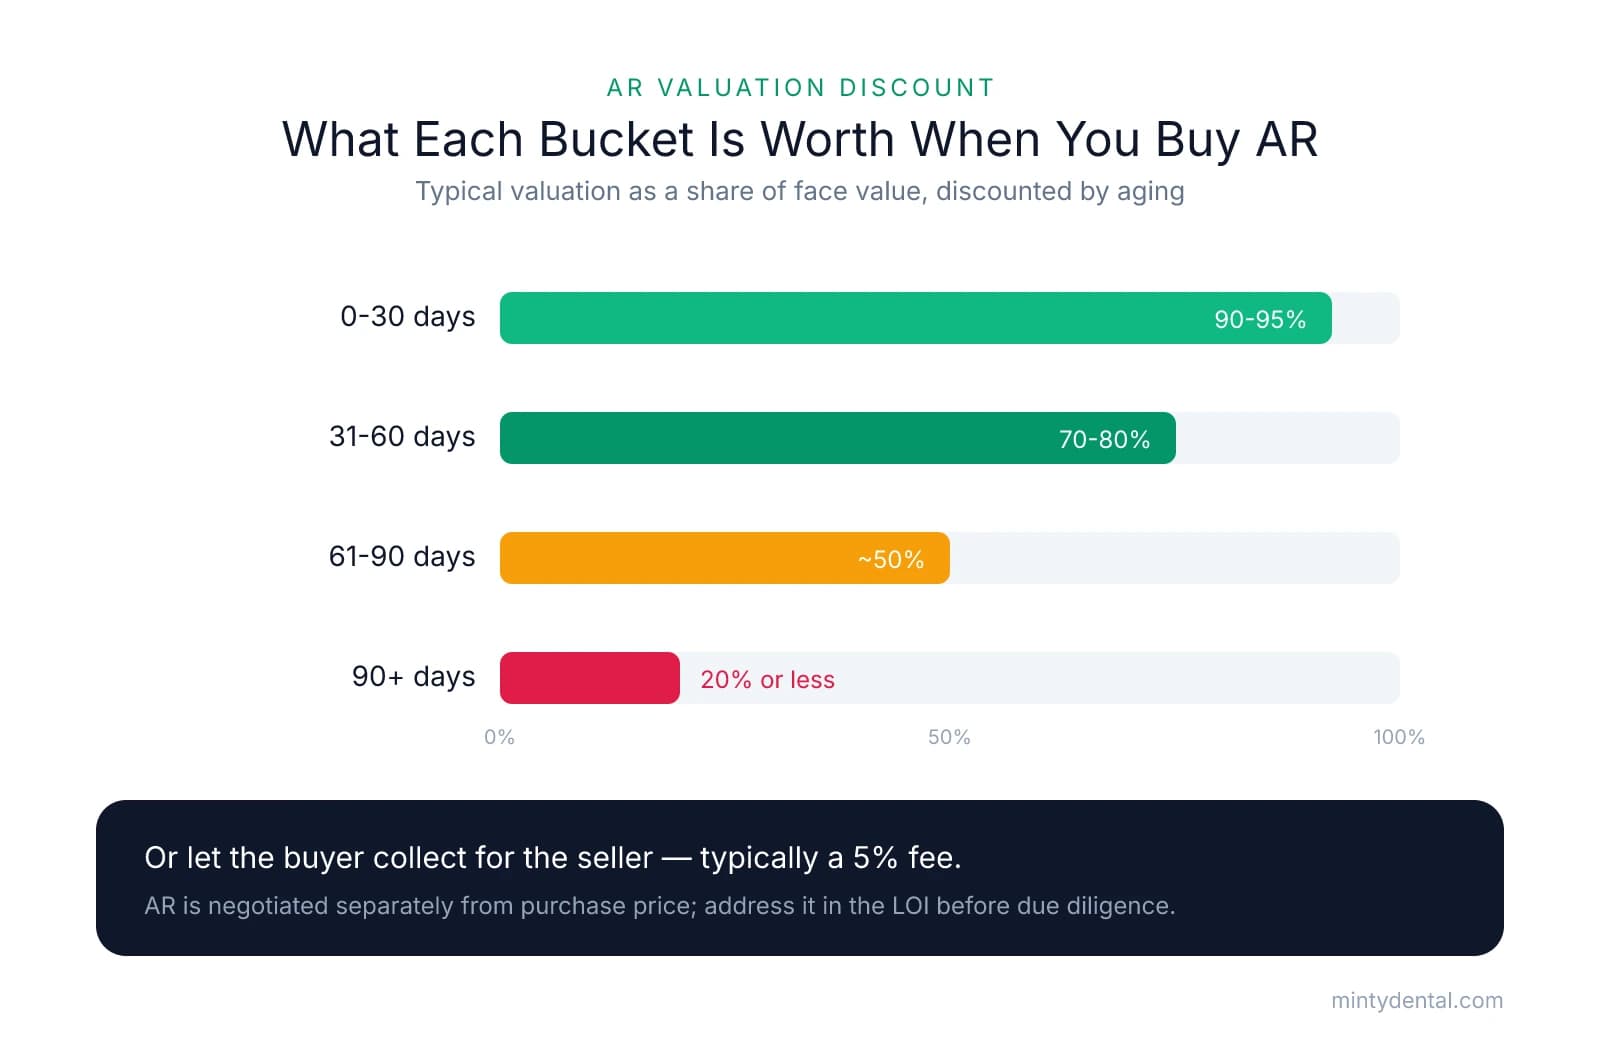
Valuation discount framework by aging bucket. When a buyer purchases the AR, each bucket is discounted according to its collection probability. A common structure values current balances near 95%, mid-range balances around 50%, and 91-plus day balances at 20% or less:
| Aging Bucket | Typical Valuation |
|---|---|
| 0-30 days | 90-95% of face value |
| 31-60 days | 70-80% |
| 61-90 days | ~50% |
| 90+ days | 20% or less |
Purchasing the AR can reduce the working capital a buyer needs in the first months, because collections begin arriving early rather than after a fresh billing cycle builds up. That benefit tends to matter most for buyers with tight post-closing liquidity, and it pairs well with an understanding of how seasonal cash flow swings affect the first year.
If the seller retains the AR, the purchase agreement should specify how post-closing payments will be tracked, deposited, and reported. Without that protocol, disputes over which party a given payment belongs to are common, since patients often continue paying the practice they know.
A bloated 90-plus bucket paired with a low collection rate points to front-office systems that will need investment, which shapes the buyer's first-year operating plan and day-one priorities.
Sources & References
The data and claims in this article are drawn from the following sources. We prioritize government data, peer-reviewed research, and established industry publications to ensure accuracy.
- Dental Aging Reports: What They Are and Why They Matter - Teero— www.teero.com
- AR Aging Past 90 Days: 14 Write-Off Statistics - Resolve Pay— resolvepay.comIndustry
- collection probability drops below 50%— content.one.lumenlearning.com
- How to Reduce Aging A/R in Dental Practices 2026 - AnnexMed— annexmed.comIndustry
- Financial Due Diligence for Dental Practices: What to Look For in 2026— duckettladd.comIndustry
- 3 Big Steps During the Dental Practice Due Diligence Process— www.adstransitions.com
- Negotiating Accounts Receivable When Buying a Dental Practice— www.eisneramper.com
- 20 Essential Negotiation Terms to Include in your Dental Practice ...— practiceorbit.comIndustry
Ready to evaluate a practice's financial health?
Understanding AR aging reports is crucial when assessing a dental practice acquisition. Minty's buying experts guide you through complete due diligence to identify red flags and negotiate confidently.