Dental Practice Production Per Hour: Benchmarks and How to Improve

Co-Founder, Minty Dental
In Summary
- Production per hour equals total gross production divided by total clinical hours worked, calculated separately for each provider.
- Two providers with identical daily totals can have very different per-hour rates once late starts, schedule gaps, and overtime are counted.
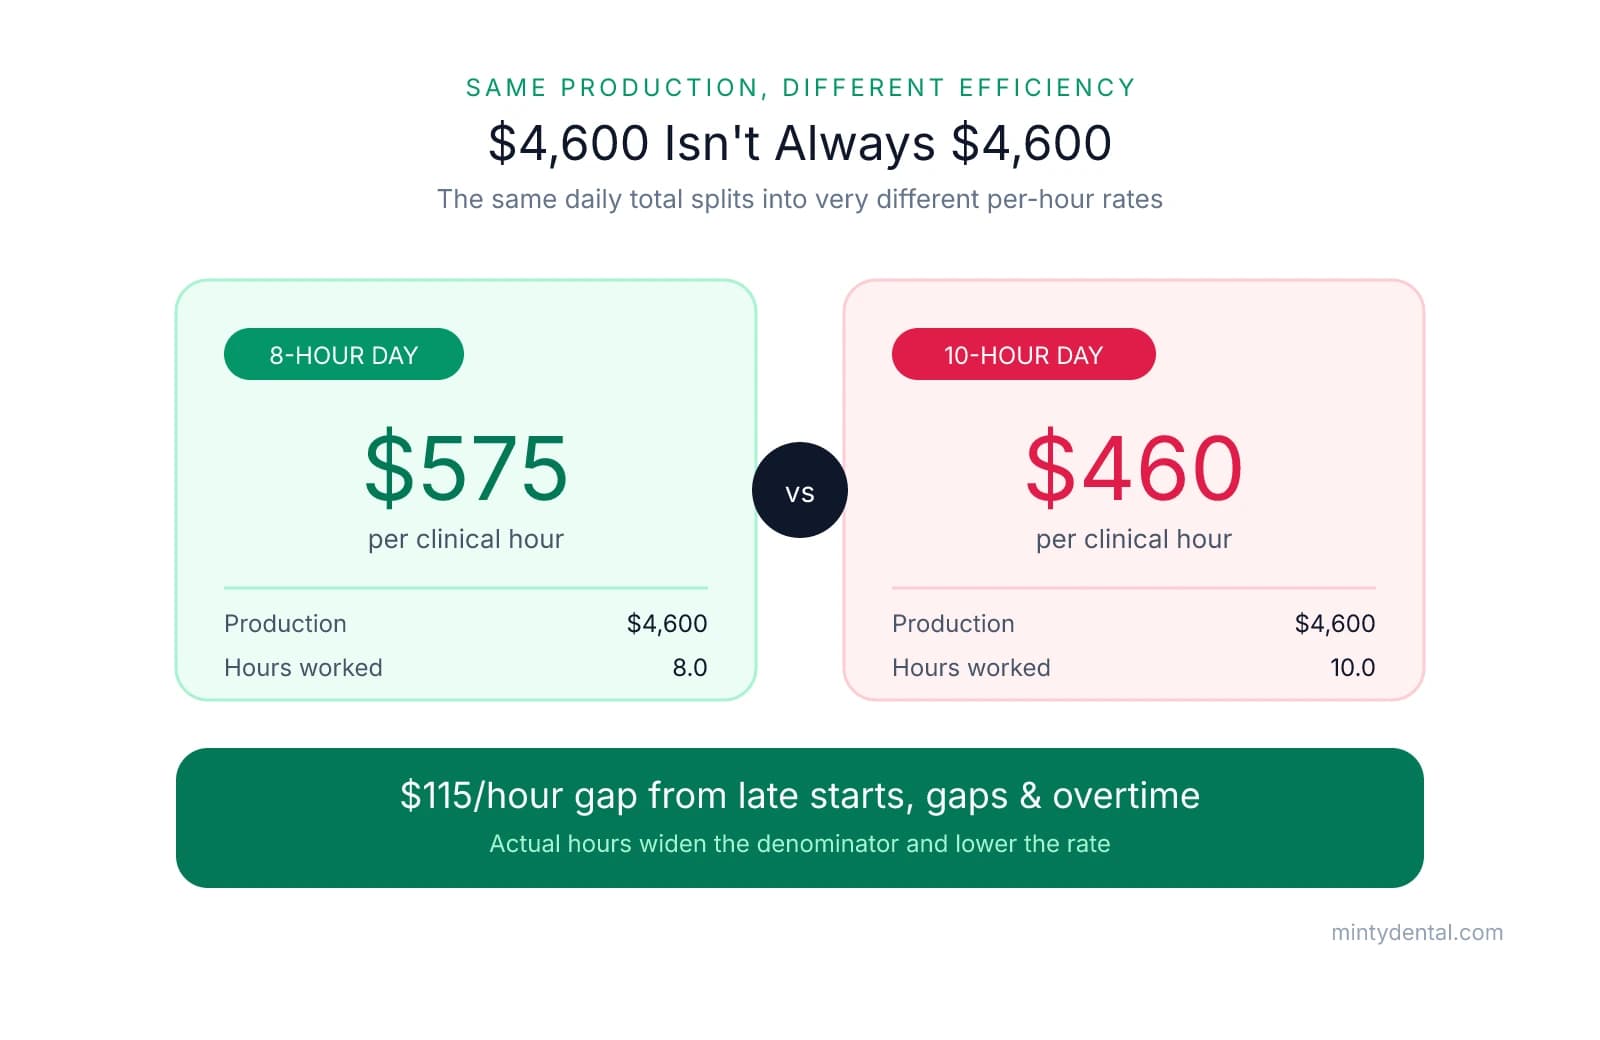
- A doctor producing $4,600 across 8 hours runs at $575 per hour; the same $4,600 across 10 hours drops to $460 per hour.
- Use gross production per hour for internal scheduling analysis and adjusted (net) production per hour for profitability and PPO decisions.
- Most practice management systems, including Dentrix, Eaglesoft, and Open Dental, can generate the provider production and hours data you need.
Production Per Hour Is the Metric That Reveals What Daily Totals Hide
Production per hour is total gross production divided by total clinical hours worked, calculated per provider. You run the number separately for each doctor and each hygienist, because their fee schedules, procedure mixes, and time demands differ enough that a blended figure hides more than it shows.
Total daily production is an incomplete signal on its own. A day with long midmorning gaps, a late start, and a few low-value procedures can post the same gross number as a tighter, fully booked day. The daily total treats both as equivalent, but the hours spent producing them are not, and that difference determines how much room you have to grow without adding chair time. Tracking production per hour separately for hygiene helps you see whether that department is producing at its capacity or simply filling time.
To calculate it, pull each provider's gross production for a defined period, then divide by the actual clinical hours worked during that same period. Actual hours matter more than scheduled hours, because gaps and overtime change the denominator.
Consider a solo doctor producing $4,600 in a day:
| Daily production | Clinical hours worked | Production per hour |
|---|---|---|
| $4,600 | 8.0 | $575 |
| $4,600 | 10.0 | $460 |
The same gross figure yields a $115 per hour difference in efficiency depending on how many hours it took to reach it. Late starts, open gaps, and overtime that stretch the day widen the denominator and lower the rate.
Two versions of this metric serve different purposes. Gross production per hour uses full practice fees before write-offs, which makes it useful for internal scheduling analysis because it reflects clinical output independent of payer mix. Adjusted production per hour subtracts PPO write-offs and other adjustments, so it maps more closely to what you expect to collect and is the more relevant number for profitability and PPO strategy decisions. Both are worth monitoring as recurring KPIs rather than one-time snapshots.
Most practice management systems, including Dentrix, Eaglesoft, and Open Dental, can generate provider production reports and hours-worked logs, which supply both inputs directly.
What Benchmarks to Compare Your Production Per Hour Against
Once you have your own gross and adjusted production per hour, the next question is what a healthy number looks like. Several credible sources publish benchmarks, though each uses a different unit of measurement, so converting them to a common per-hour basis makes the comparison usable.
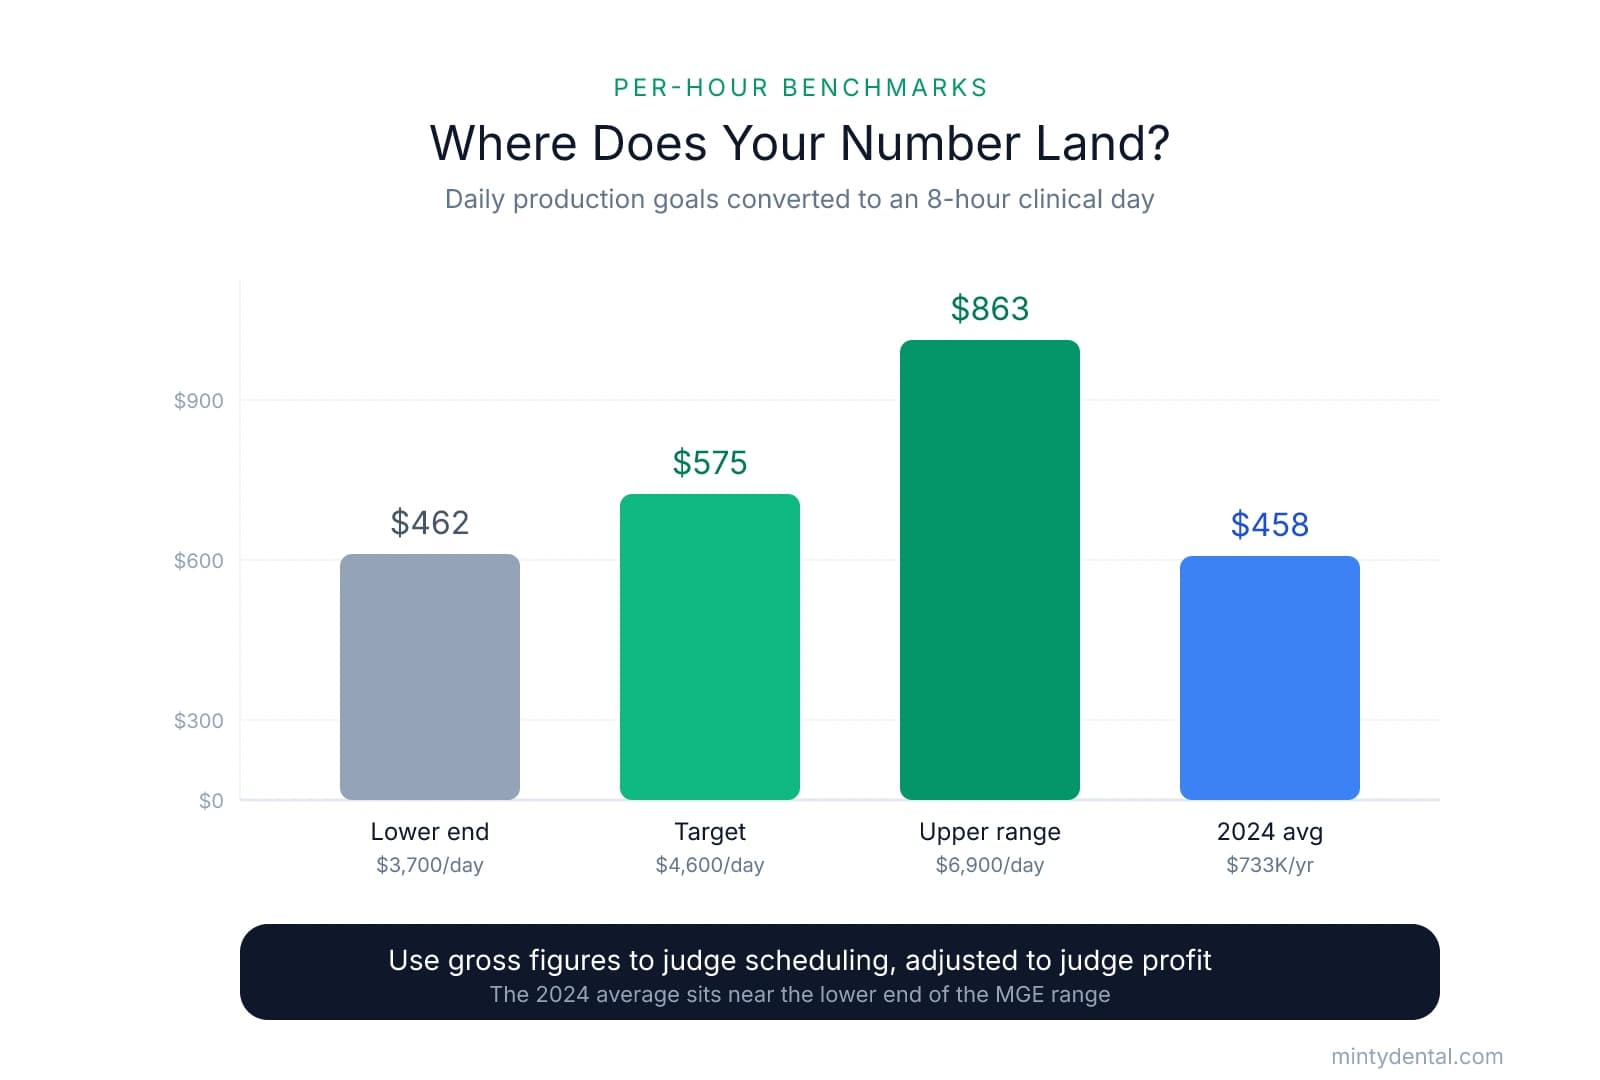
For solo general dentists doing routine restorative and preventive work, daily production goals range from $3,700 to $6,900 or more, with $4,600 per day (roughly $100,000 per month) cited as the ideal target for a bread-and-butter practice running with a hygienist or two. Production above $6,900 per day may be sustainable in the short term, but it often signals that the schedule has more demand than one provider can serve, which is a common trigger for evaluating whether to add an associate. Converting these daily figures to hourly equivalents over an 8-hour clinical day:
- $3,700/day is about $462/hour (lower end, acceptable)
- $4,600/day is about $575/hour (target for bread-and-butter practices)
- $6,900/day is about $863/hour (upper range)
Average doctor production benchmark: In the 2024 survey of general dentists, average total practice production per doctor was $977,077, with estimated doctor personal production of approximately $733,000. Spread across roughly 200 working days and 8 clinical hours, $733,000 in personal production works out to about $458 per hour, which sits near the lower end of the MGE range.
A third lens measures output per operatory, which helps when you want to know whether your physical capacity is being used well. Industry tiers for annual production per operatory land as follows:
| Production per operatory (annual) | Tier |
|---|---|
| Under $175K | Struggling |
| $175K to $250K | Average |
| $275K to $350K | Strong |
| $350K+ | Best-in-class |
These ranges are reference points, not verdicts, because payer mix, geography, and procedure mix shift them. A PPO-heavy practice will show lower adjusted production per hour than a fee-for-service practice operating at the same efficiency, because write-offs reduce the collectible portion of each gross dollar. When you compare against benchmarks to judge scheduling efficiency, use gross figures. When you compare to judge profitability, use adjusted figures, and consider whether renegotiating PPO fees would close part of the gap.
Three Scheduling Changes That Raise Production Per Hour Most Reliably
Once you know your production per hour and where it sits against benchmarks, the next step is changing the schedule itself. Three interventions tend to move the number most reliably, and each works on a different part of the production equation. Block scheduling raises the value of appointments already on the schedule, no-show reduction recovers production from appointments that disappear, and hygiene handoffs convert clinical findings into future scheduled revenue.
1. Block scheduling for high-value procedures. Block scheduling reserves dedicated portions of the day for specific procedure types rather than filling slots in the order patients call. The mechanism is protective: high-production work like crowns, implants, and multi-surface restorations gets first claim on prime chair time, so it cannot be displaced by shorter, lower-value appointments booked earlier. A crown prep produces far more per hour than a single-surface composite, and placing it in the first two to three clinical hours, when the doctor is freshest, also tends to reduce chair time and rework.
A practical way to implement it:
- Categorize your procedures by production value and typical chair time using last year's data.
- Reserve the first 2 to 3 morning hours for high-production restorative and surgical work.
- Route hygiene, exams, and short procedures into afternoon slots.
- Release unfilled blocks two to three days out so they do not sit empty.
2. Reducing no-show and late-cancellation leakage. The average dental practice loses about $47,000 annually to patient no-shows, and practices with no-show rates above 15% show 23% lower profitability than those below 8%. The cost is high because an empty operatory still carries full staff wages and overhead. Two interventions tend to return the most: a two-touch confirmation protocol (one contact roughly a week out and a second the day before) and a maintained short-notice waitlist so a canceled slot can be refilled the same day. Together they recover production without adding a single new patient.
3. Hygiene-to-doctor handoff protocols. The hygiene department contributes 25% to 35% of total practice production, and more than 50% of restorative work is identified during hygiene visits. A structured handoff, where the hygienist verbally presents findings to the doctor in the patient's presence before the exam begins, converts more of those findings into scheduled treatment rather than letting them accumulate in an unscheduled treatment report. This tends to raise same-day acceptance, which connects directly to your case acceptance rate.
Turning Production Per Hour Into a Monthly Tracking Habit
A one-time calculation tells you where you stand today. A monthly cadence tells you which direction you are moving, and that direction matters because small declines compound. If production per hour drops 10% and holds there across roughly 200 working days, the annual revenue gap runs into six figures for most general practices. Catching that drift early, before it settles into the schedule as a habit, is the practical reason to track the metric on a recurring basis.
A workable monthly review takes about 30 minutes:
- Pull provider production and hours from your practice management system for the closing month, running the report separately for each doctor and each hygienist.
- Calculate production per hour for each provider using the formula from section 1.
- Compare each figure to the prior month and to the benchmarks in section 2.
- Diagnose any gap. A shortfall traces to either scheduling (open gaps, no-shows, a low-value procedure mix) or clinical performance (case acceptance and treatment plan completion). Each points to a different fix, and matching the intervention to the actual cause is what makes the review useful.
Running the number per provider rather than as a blended practice-wide average is what reveals where the room to improve actually sits. A strong doctor rate can mask a hygiene department producing well below its capacity, and a blended figure hides that entirely. When one provider consistently trails, the associate production diagnostic walks through the likely causes.
This metric also connects to what the practice is worth. Because dental practice valuations increasingly rest on EBITDA and quality of earnings rather than gross collections, a practice that produces more per hour while holding overhead down demonstrates the kind of durable, efficient earnings that support a higher multiple. Owners planning to sell in two to five years benefit from establishing the trend line now, since a documented three-year improvement is more persuasive to a buyer than a single strong quarter. If a sale is on the horizon, the broader levers in increasing practice value before selling build on the same foundation.
A reasonable first action this month: calculate your production per hour using the formula from section 1, compare it to the benchmarks in section 2, and pick the single scheduling change from section 3 most likely to close your gap. Implement it over the next 30 days, then measure again.
Sources & References
The data and claims in this article are drawn from the following sources. We prioritize government data, peer-reviewed research, and established industry publications to ensure accuracy.
- Average Dental Office Production: Break the Benchmarks and Rule ...— boomcloudapps.comIndustry
- Essential KPIs for Dentists: Tracking Production, Collection, and Overhead— sunrisedentalsolutions.comIndustry
- How Much Should a General Dentist Produce Per Day?— www.mgeonline.com
- Higher production and long-awaited stability: The 2024 DE/Levin Group ...— www.dentaleconomics.comIndustry
- A Guide to Efficient Dental Block Scheduling (With Templates) - Teero— teero.com
- Dental Practice No Shows Cost You More Than You Think— scottleune.com
- Dental Practice Research - American Dental Association— ada.orgIndustry
- Hygiene Analysis | Aligned Dental Partners— aligneddentalpartners.comIndustry
- Average Dental Office Revenue: 2026 Data & Benchmarks - DentiMax— dentimax.comIndustry
Ready to maximize your practice's hourly production?
Optimizing scheduling and operations is key to improving production per clinical hour. Minty's operations team specializes in streamlining practice workflows and business systems to help independent practices work more efficiently and profitably.