Why the Same PPO Pays Different Rates by Zip Code

Co-Founder, Minty Dental

In Summary
- PPO carriers divide the country into geographic zones and set different allowed amounts for each CDT code in each zone, so the same procedure pays differently depending on where your practice is located.
- The underlying data comes from UCR benchmarks compiled from actual claims submitted across the country, organized by geography and reported at multiple percentile levels.
- Local cost factors like staff wages, rent, and prevailing charges drive the differences between markets, and carriers calibrate their allowed amounts to reflect those conditions.
- Carriers treat their exact methodology and percentile selection as proprietary, so you receive only the resulting fee schedule, not the formula used to build it.
- Benchmarking your contracted rates against local UCR data is the first step in identifying whether your fee schedule reflects your actual market.
PPO Fee Schedules Are Built Around Geography, Not a Single National Rate
When a colleague in another city mentions what their PPO pays for a D2740, and the number is meaningfully higher than yours, the difference usually isn't a negotiating advantage they have that you don't. It's geography. PPO carriers don't publish one national fee schedule that every participating dentist receives. Instead, they divide the country into geographic zones, typically based on groupings of zip codes, and set separate allowed amounts for each CDT code within each zone. Your contracted rate for a porcelain crown is specific to your zone, not to dentistry in general.
The data behind those zone-level rates comes from UCR benchmarks, which stands for Usual, Customary, and Reasonable. Carriers compile fee data from actual claims submitted across the country, then organize that data geographically and report it at multiple percentile levels. FAIR Health's benchmark database, for example, covers 493 geographic areas and provides dentists access to charge data from the 50th through the 95th percentile. That range gives you a picture of what dentists in a given area actually charge, from the median up to the higher end of the market.
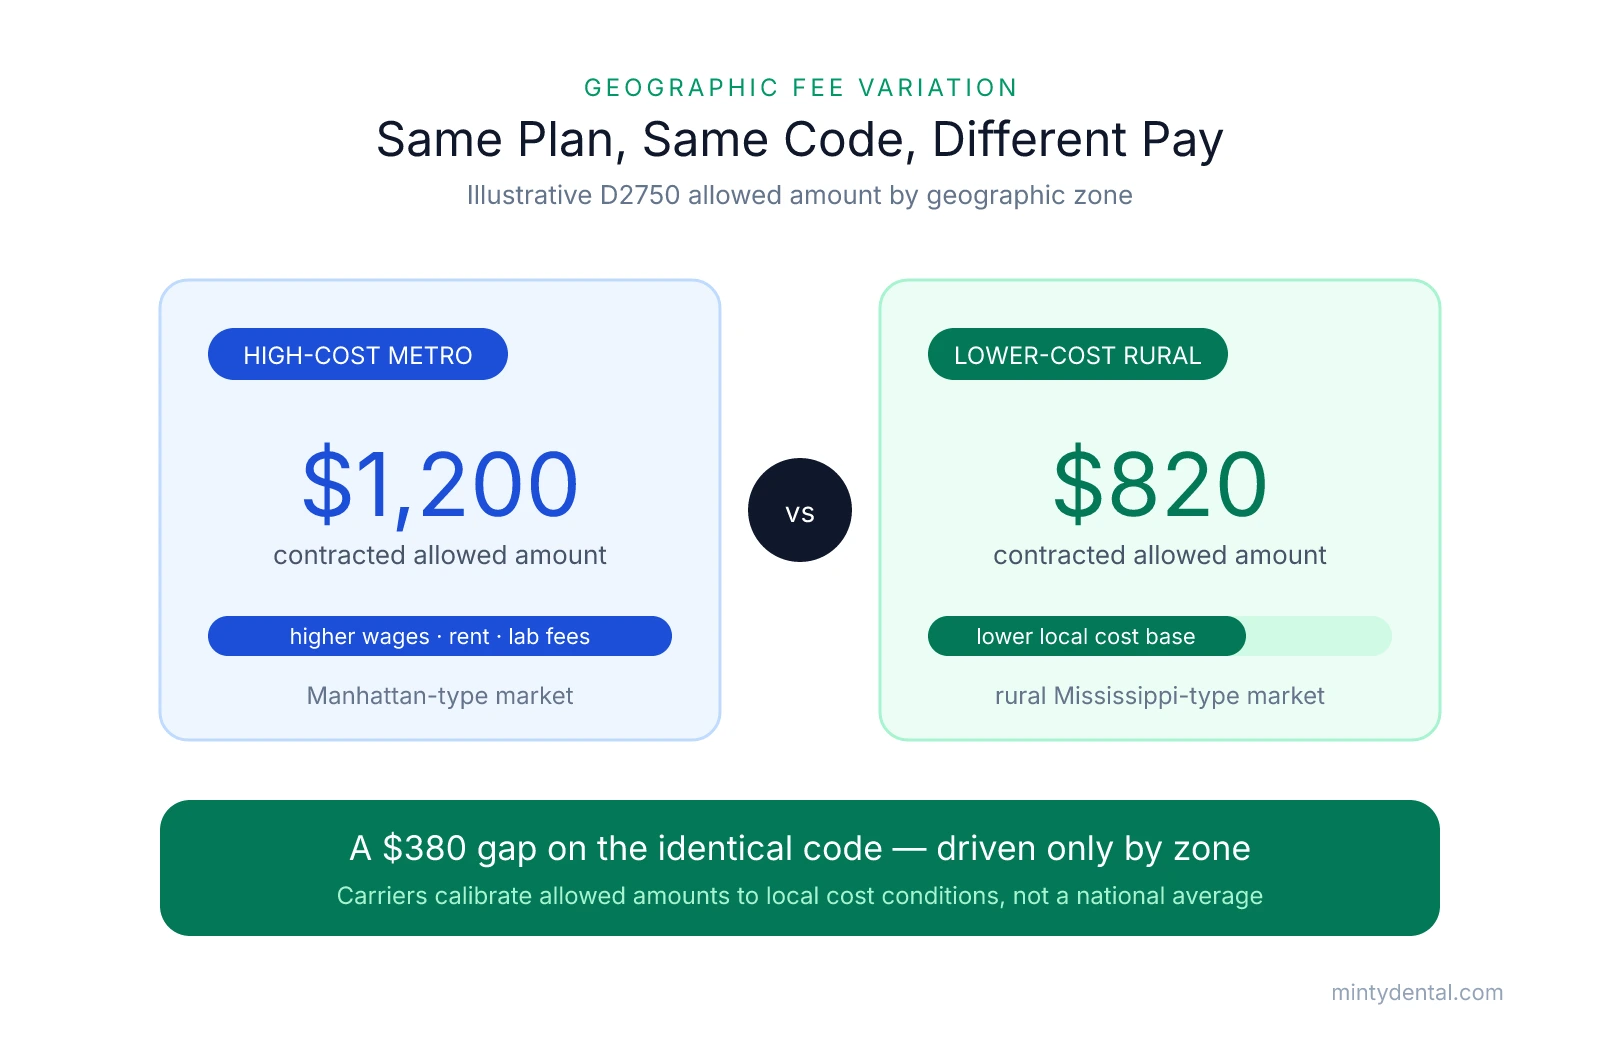
A D2740 in Manhattan involves different underlying costs than the same crown in rural Mississippi. Staff wages, office rent, lab fees, and the general cost of doing business vary substantially between those markets, and so do what local dentists typically charge. The carrier's allowed amount is calibrated to reflect that local cost environment, not a nationwide average. This is why fee variation between locations is built into the system from the start, not an anomaly or an error.
To make that concrete: imagine a hypothetical D2750 posted to two different practices on the same PPO plan. The practice in a high-cost metro zone has a contracted allowed amount of $1,200. The practice in a lower-cost rural zone has a contracted allowed amount of $820 for the identical code. Same carrier, same plan, same procedure. The difference comes entirely from which geographic zone each practice falls into. These numbers are illustrative, not benchmarks, but the mechanism is real.
What you don't get to see is the formula behind your rate. Carriers treat their exact methodology and their choice of which percentile to pay at as proprietary, and they guard it closely. The employer purchasing the group plan often has some input into the percentile tier, which affects what the plan pays, but that negotiation happens between the carrier and the employer, not between the carrier and your practice. By the time you're credentialing and signing a participation agreement, you receive the resulting fee schedule for your zone. Understanding that the schedule reflects a geographic pricing model, and knowing that those schedules do get updated periodically, is the foundation for evaluating whether what you're being paid actually reflects your market.
How the Network Stack Can Apply a Different Geographic Rate Than You Expect
Geography explains a lot of the rate variation between practices in different markets, but it doesn't explain everything. Sometimes the same practice receives two different allowed amounts from the same carrier for the same code on different claims, or a patient's EOB shows an allowed amount that doesn't match the fee schedule loaded in your practice management system. That's often not a geographic discrepancy. It's a network stack problem.
When a claim is adjudicated, the carrier's system doesn't just apply your contracted fee schedule automatically. It identifies which contractual path connects your practice to that specific patient's plan, and it prices the claim under that path's fee schedule. For some patients, the path is your direct contract with the carrier. For others, the claim travels through a network swap, where two carriers share rosters to extend their geographic reach, or through a leased umbrella network, where a third-party company licenses access to your participation and applies its own contracted rate. Each path carries its own fee schedule, and each of those fee schedules can have its own geographic calibration.
The practical consequence is that a patient presenting a Guardian card might have their claim adjudicated under a leased network's fee schedule rather than your Guardian direct rates, and the leased network's allowed amount for your zip code may be lower than what your Guardian contract specifies. The architecture behind these leased network arrangements is worth understanding in full, because the rate differential isn't random. It follows from which schedule the system selects when it routes the claim.
That gap has real staying power over time. Billed-fee trends across dentistry run roughly 2.6% to 2.8% annually, while contracted reimbursement from carriers has grown only around 0.7% to 1.4%. A leased network rate that starts below your direct contract rate compounds that shortfall year over year, and it's compounding quietly inside claims you may assume are being paid correctly. It's no surprise that more than half of dentists named low reimbursement as a top concern in late 2025 ADA Health Policy Institute polling.
The EOB is where you can catch this. Two signals are worth watching. First, check the payer name on the EOB against the carrier your patient presented at check-in. If they don't match, or if an unfamiliar network name appears in the payment processing section, the claim was routed through a swap or lease rather than your direct contract. Second, compare the allowed amount on the EOB against the fee schedule in your PMS for that code. If the allowed amount is lower than your contracted rate and the payer name doesn't match, a different geographic fee schedule is almost certainly in play. Reading and verifying every EOB against what you expected to be paid helps catch adjudication outcomes like this one.
None of this is intentional misdirection. It's the architecture working as designed. But the design means that your contracted rate for a given zip code may not be the rate that actually prices every claim from patients in that zip code.
Benchmarking Your Contracted Rates Against Your Geozip
Start with your top 20 to 30 CDT codes by production volume. Pull the allowed amount for each from your current fee schedule or, if you don't have an updated schedule in hand, from recent EOBs. This becomes your baseline data set: what the carrier actually pays your practice, by code, right now.
The next step is comparing those amounts against published benchmarks for your specific geographic area. FAIR Health's FH Fee Estimator, available at feeestimator.org, provides percentile benchmarks from the 50th through the 95th percentile for dentistry across 493 geozips, and it's available to solo and small practices by license. Those percentiles reflect actual non-discounted fees as reported by dentists in your area, so you're comparing your contracted allowed amount against what practices in the same market are charging.
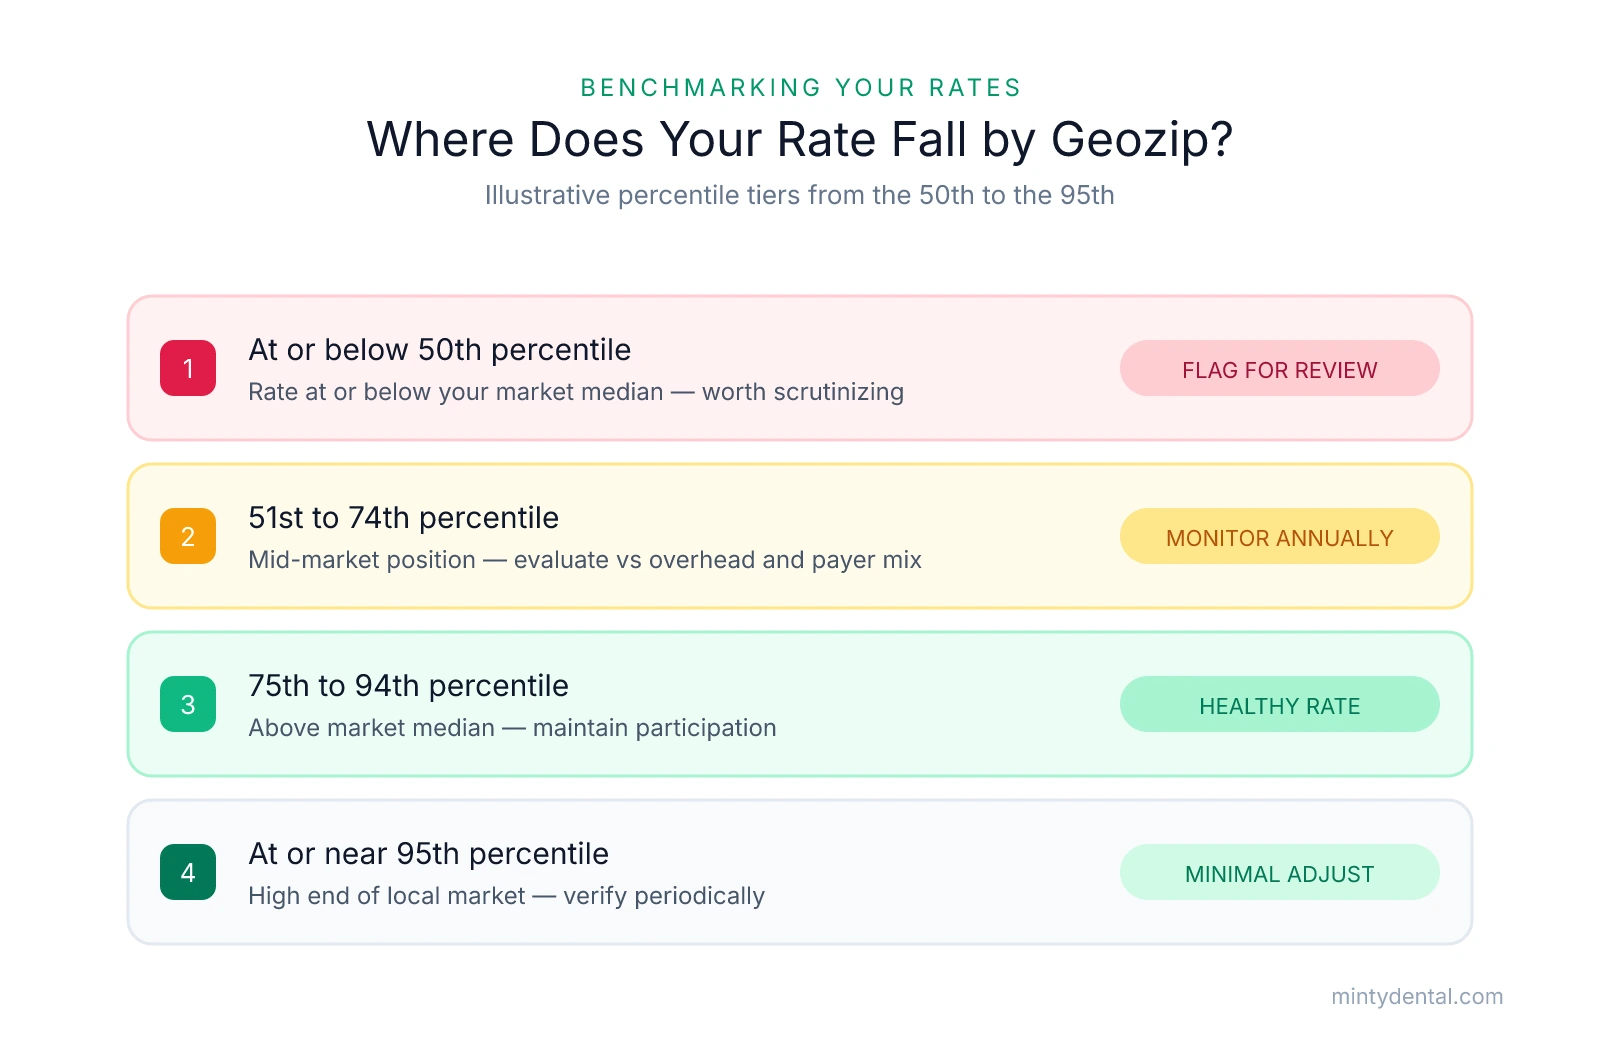
For each high-volume code, you want to know which percentile your contracted rate falls at. A contracted rate sitting at or below the 50th percentile for your geozip means the carrier is paying you at or below the median charge for your market. That's worth scrutinizing, particularly if your practice operates in an area with above-average overhead costs.
| Benchmark Percentile | What It Signals | Action to Consider |
|---|---|---|
| At or below 50th | Rate is at or below the market median for your geozip | Flag for review; request a fee schedule update from the carrier |
| 51st to 74th | Rate reflects a mid-market position | Monitor annually; evaluate against your overhead and payer mix |
| 75th to 94th | Rate is above the market median | Maintain participation; focus review on other plans or codes |
| At or near 95th | Rate is at the high end of the local market | Minimal adjustment needed; verify periodically |
Percentile tiers are illustrative. Your contracted rates may fall at different levels across different CDT codes and carriers.
Review contracted fee schedules annually and conduct negotiations individually with each plan. That second point matters: what you learn from benchmarking one carrier doesn't transfer directly to a conversation with another.
One thing that affects your benchmarking data before you even get to a negotiation conversation: some carriers use submitted charges when calibrating future maximum allowable fees. If your practice has been billing below your actual UCR, you may have inadvertently anchored the carrier's reference point for your rates lower than your market supports. This is why submitting your full office fee on every claim is important regardless of what the carrier's allowed amount is. The write-off happens through the adjustment; the submitted charge stays on the record.
Benchmarking your payer mix as a whole, not just individual fee schedules, can also clarify which carriers deserve the most attention during a review cycle. Understanding how each plan contributes to your overall collections makes it easier to prioritize where a rate improvement would actually move the needle.
Using Geographic Rate Data to Request a Fee Schedule Review
The codes where your allowed amount falls furthest below the local percentile benchmark are your strongest candidates for a fee schedule review request, because those gaps are documentable. You're not asking the carrier for more money in the abstract; you're showing that your contracted rate for a specific CDT code in your geozip sits below what dentists in the same market are charging.
When you contact the carrier, start with the provider relations representative assigned to your region. Email is the right medium to open with, because it creates a record of your request and gives you space to present the data clearly. Identify two to four codes where the gap between your allowed amount and the local benchmark percentile is largest. For each one, cite the CDT code, your current contracted allowed amount, the benchmark percentile your rate falls at, and the data source and geographic area you used. That's a credible, specific case. A general request for a rate increase without supporting data is easy to decline; a request that shows your D2740 allowed amount is below the 50th percentile benchmark for your geozip is harder to dismiss.
Frame the request around local market conditions throughout. The carrier already knows that their fee schedules are geographically calibrated, so market language connects to how they think about their own data. What you're arguing is that the current allowed amount no longer reflects your market accurately, not that you feel undercompensated.
Practices in areas with fewer dentists have more leverage, because supply-and-demand dynamics give the carrier less flexibility to let a practice walk away. If you're one of a small number of participating dentists in your zip code, that's worth including in your request as a point about patient access, not as a threat.
Carriers are not required to increase fees, and results vary. But if you go through this process and find that your benchmarks are genuinely low, not because of a carrier mismatch but because your geozip is a lower-cost market and the allowed amounts reflect that accurately, the more useful question shifts. At that point, the issue isn't whether you can negotiate the rate up; it's whether participating in the plan makes economic sense. That's a different analysis, and working through a PPO exit has its own sequencing considerations worth thinking through carefully before making a decision.
If you've noticed that your CO-45 write-offs are large relative to production, the geographic fee schedule is usually where the investigation should start. A write-off percentage that feels high often traces directly to contracted allowed amounts that don't reflect the local market, whether because the rates were set at a low benchmark percentile, haven't been updated in years, or are being applied through a leased network at rates below your direct contract.
Sources & References
The data and claims in this article are drawn from the following sources. We prioritize government data, peer-reviewed research, and established industry publications to ensure accuracy.
- FH Fee Estimator for Healthcare Professionals - FAIR Health— fairhealth.orgIndustry
- Answering some questions about fees - Dental Economics— www.dentaleconomics.comIndustry
- Inside the PPO Stack: A Technical Guide to Dental Network ...— dentalogic.com
- Explanation of Benefits Statement | American Dental Association— www.ada.orgIndustry
- The Dental Care Market - American Dental Association— ada.orgIndustry
See Where Your PPO Crown Fee Stands by Zip Code
Your contracted rate is set against local data, and that data varies block by block. Run a quick check to see how your current allowed amounts compare to what group fee schedules are paying in your area.