How Long Does a New Dental Associate Take to Reach Full Production?

Co-Founder, Minty Dental

In Summary
- The ramp-up period is the interval between an associate's start date and the point where they're consistently producing at or near their sustainable ceiling — typically 6 to 12 months in a private practice setting.
- New graduates usually take longer than experienced associates to reach full production, often landing at the longer end of that range.
- Even at full capacity, associates typically produce 25 to 30% less per day than the practice owner, so "full production" for an associate is a different ceiling than your own output.
- The ramp-up unfolds in three phases: schedule-building (months 1 to 3), momentum-building (months 3 to 6), and stabilization (months 6 to 12 or beyond).
- Overhead costs start on day one while production builds slowly, which means the ramp-up period carries a real, calculable cash flow cost for the owner.
A New Associate Typically Reaches Full Production Between 6 and 12 Months
The ramp-up period is the time between a new dentist joining a practice and reaching consistent, full-capacity clinical production. That interval matters more to your cash flow than it does to the associate's resume.
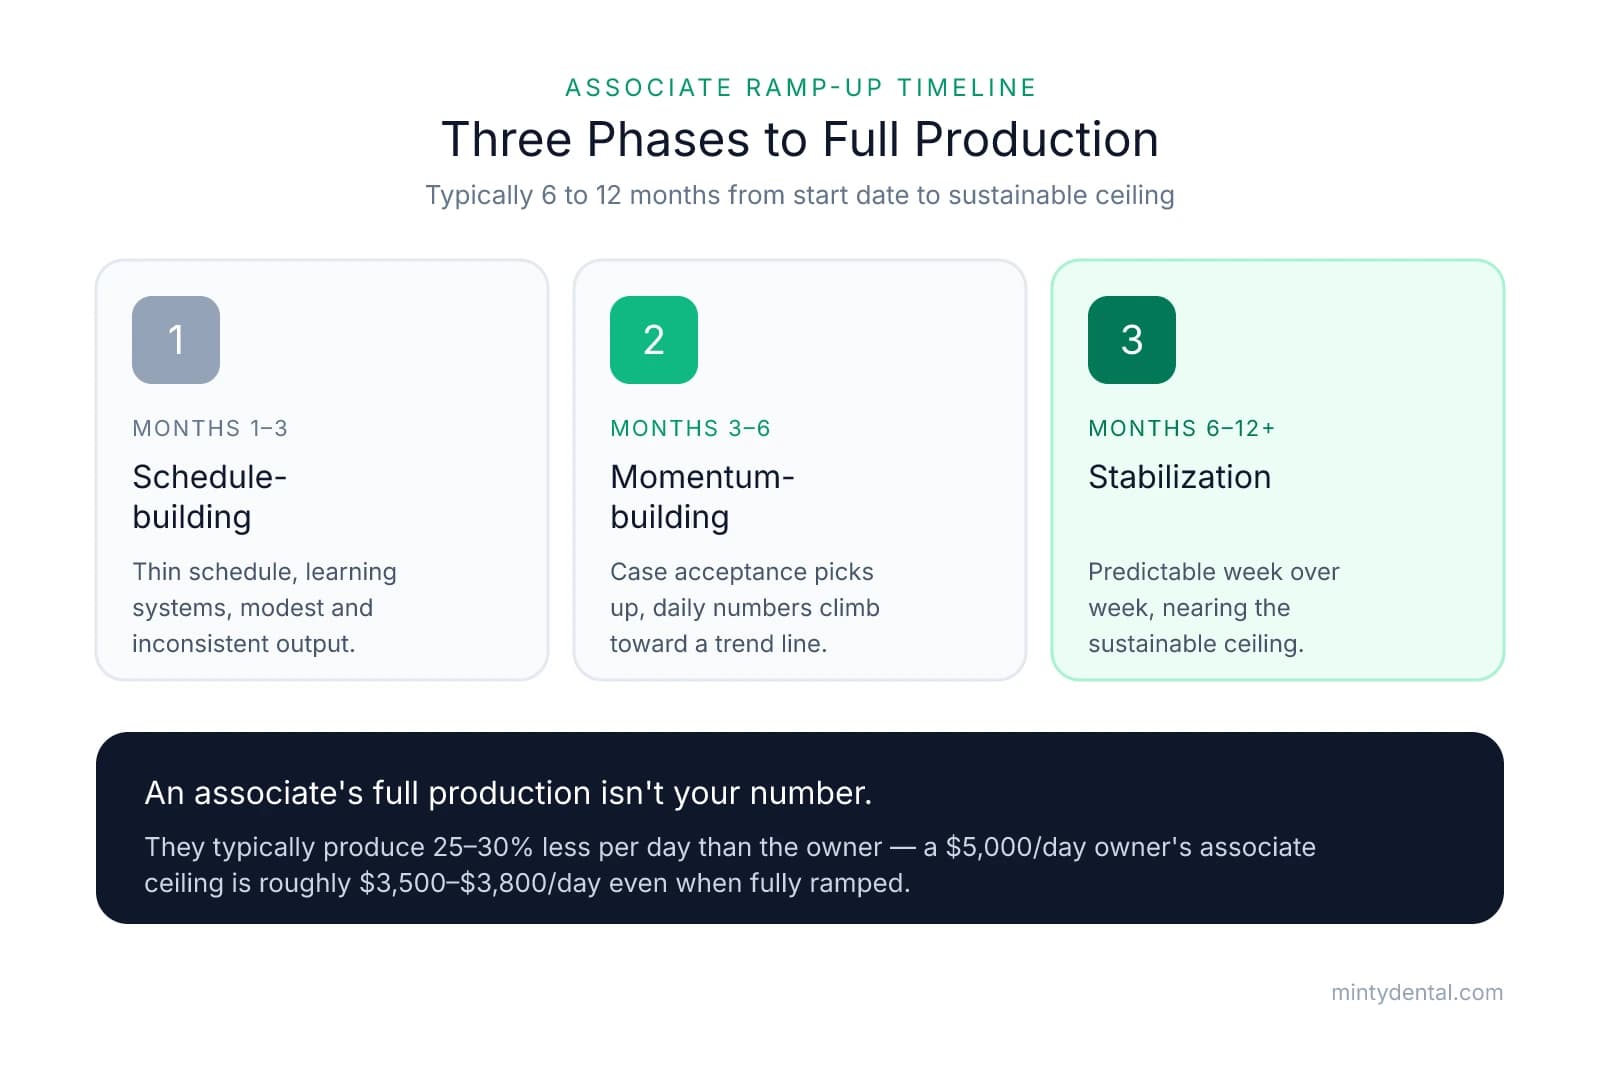
For most private practices, that window runs six to twelve months. New graduates tend to land at the longer end: they're still building clinical speed, learning to present treatment, and establishing rapport with patients they've never met before. An associate coming in with three or four years of practice experience will usually compress that timeline, sometimes reaching a reliable production cadence by month four or five. But even experienced hires rarely hit the ground at full pace.
One thing worth clarifying before you start benchmarking: "full production" for an associate is not the same number as your own daily output. Associates typically produce 25 to 30% less per day than the practice owner, even once they've fully settled in. The gap reflects a combination of case mix, patient trust built over time, and the fact that owners tend to attract or retain the higher-complexity work. If you're producing $5,000 a day, a realistic ceiling for a fully ramped associate in your practice might be $3,500 to $3,800 per day. That's the target you're working toward during the ramp-up, not your own number.
The ramp-up itself tends to move through three rough phases. During the first three months, the primary constraint is schedule density: the associate has limited patients assigned, is learning your systems and workflows, and may be working only partial days while you fill their chairs. Production in this phase is often modest and inconsistent. Months three through six look different once the schedule starts to fill and the associate's name begins to mean something to patients who've seen them once or twice. Case acceptance picks up, treatment plans get completed rather than deferred, and daily production numbers start climbing toward a recognizable trend line. The final phase, roughly months six through twelve, is about stabilization: production becomes predictable week over week, patient retention with the associate improves, and the daily average begins to approach that sustainable ceiling.
What makes this financially important for you as the owner is the timing mismatch. Compensation, assistant time, supplies, and your share of operatory overhead all start accumulating on day one. Production follows weeks or months behind. That gap has a real cost, and understanding it in advance is what separates a well-planned hire from one that creates unexpected cash flow pressure. If you're still evaluating whether the practice can support a hire at all, the financial readiness question is worth working through first.
Your Break-Even Threshold Tells You What the Ramp-Up Actually Costs
Overhead costs don't wait for the associate to get busy. From the first week, you're paying their compensation, an additional assistant, supplies, and lab fees. The question is how much production they need to generate before those costs are covered — and how long it takes to get there.
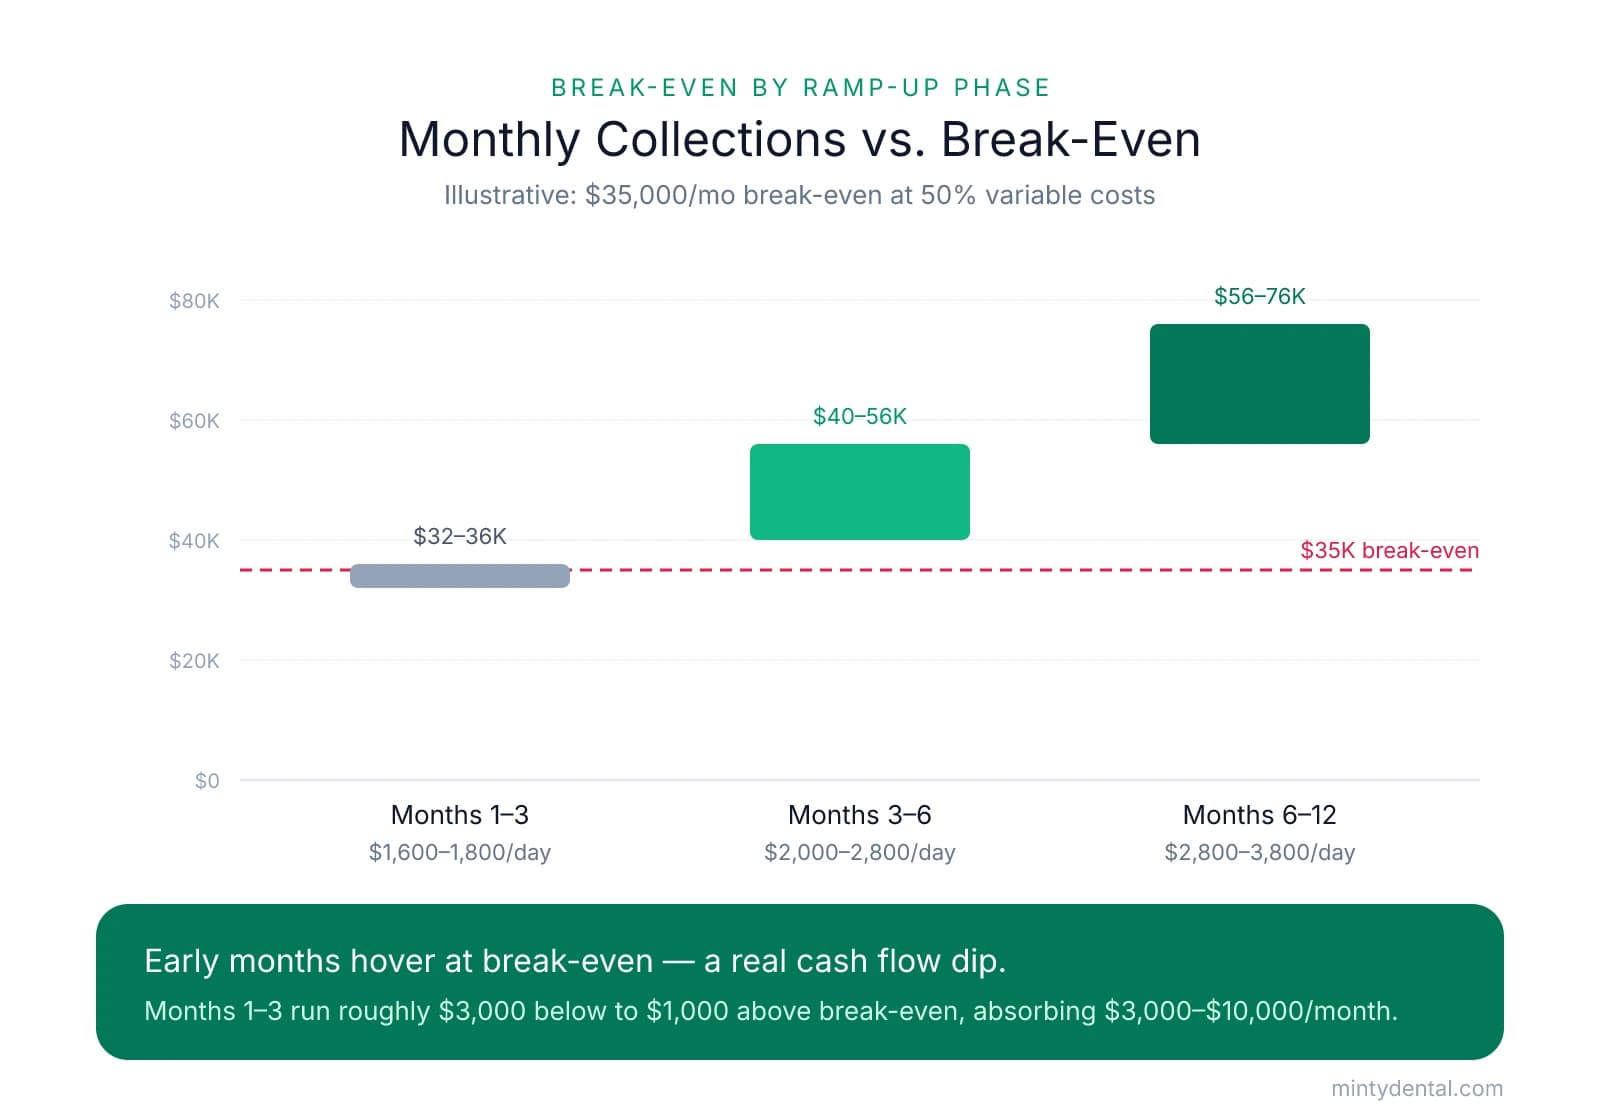
Take the fixed overhead the associate adds each month and divide it by your contribution margin ratio. If the hire adds $17,500 in fixed monthly costs (compensation floor, assistant coverage, incremental supplies and lab), and your variable costs run 50% of collections, you need roughly $35,000 per month in collections just to break even on the associate. That's the denominator that matters, not the gross production number.
At $35,000 per month across 20 clinical days, the associate needs to collect around $1,750 per day before contributing a dollar to practice profitability. New associates in the schedule-building phase typically produce $1,600 to $2,000 per day — which means they're hovering right at break-even during early months, and slipping below it on slower days. The table below shows how that plays out across the three ramp-up phases.
| Phase | Typical daily production | Monthly collections (est.) | Gap vs. $35,000 break-even |
|---|---|---|---|
| Months 1–3 | $1,600–$1,800 | $32,000–$36,000 | ($3,000) to $1,000 |
| Months 3–6 | $2,000–$2,800 | $40,000–$56,000 | $5,000–$21,000 |
| Months 6–12 | $2,800–$3,800 | $56,000–$76,000 | $21,000–$41,000 |
These are hypothetical ranges for illustration. Your break-even will differ based on your actual overhead structure and compensation model.
The cash flow gap in months one through three is real money absorbed by the practice — often $3,000 to $10,000 per month depending on how slow the schedule builds. Practices already running above 65% overhead before the hire have very little margin to absorb that shortfall. At 70% overhead with a 30% associate production split, the owner retains nearly nothing on associate-generated revenue until the ramp-up period ends and production climbs well above break-even. If your overhead is already elevated, understanding your payroll percentage relative to capacity before the hire changes the risk profile considerably.
One factor that often gets left out of these projections is hygiene production. As the associate builds a patient base, those patients cycle through hygiene. That flow can add $150,000 to $220,000 in annual hygiene revenue that most break-even models don't credit. Leaving it out understates the full economics of the hire, particularly in years two and three.
Before you extend an offer, build a 12-month cash flow model that projects the associate's production trajectory by phase, their total compensation cost under the structure you're considering — whether percentage-based or a hybrid approach, which you can work through with the associate pay calculator — and the net monthly impact on practice cash flow. That projection won't be perfect, but it will tell you whether the ramp-up period is a manageable cash flow dip or a genuine solvency problem given your current overhead structure.
Four Practice-Side Factors That Extend the Ramp-Up Period
When an associate's production is stalling, the instinct is to look at the associate. More often, the real problem is in how the practice is set up around them. Associates rarely fail because they lack clinical ability — they fail because the practice hasn't built the systems for them to succeed. Running through these four factors against your own situation will usually tell you where the delay is coming from.
Insufficient patient flow routed to the associate
An associate cannot produce what the schedule doesn't give them, yet one of the most common structural gaps owners create is hiring an associate and then expecting them to generate their own demand rather than stepping into existing demand.
A full-time associate needs roughly 800 to 1,300 active patients to support a sustainable schedule. If your practice doesn't have unassigned active patients, a backlog of unscheduled treatment, or enough new patient volume to route a meaningful share to the associate, the schedule will stay thin regardless of how capable the clinician is. Before the hire, the question to answer is whether your practice can feed the associate — not whether the associate can feed themselves.
Unfilled chair time
Every open slot in the associate's schedule is overhead with no revenue to offset it. The tools that fix this are already in your practice management software: hygiene-sourced restorative reports and unscheduled treatment lists. Hygiene exams are the most reliable pipeline for the associate's chair because the need is already documented and the patient relationship is already established. If your hygiene capacity is stretched, that bottleneck flows directly into the associate's schedule — adding hygiene days is often a precondition for keeping the associate productively busy, not an afterthought. A morning huddle that reviews the associate's open time and matches it to patients on the unscheduled list is a low-cost habit that compounds over weeks.
No treatment planning calibration between owner and associate
When the owner diagnoses four things and the associate diagnoses two, or vice versa, patients notice. That inconsistency erodes trust and quietly suppresses case acceptance — patients start wondering who's right rather than moving forward with treatment. Without benchmarks and peer comparison, associates often don't know where their clinical decisions diverge from practice expectations, and owners don't know either. Regular case review meetings, even 20 minutes once a week, close that gap. They're also where the associate learns your communication style with patients, which has a direct effect on how confidently they present treatment.
Absent mentorship and performance feedback
Associates who don't know how they're performing can't correct course. Weeks can pass without meaningful feedback, leaving associates uncertain whether their diagnosis, production, or patient relationships are meeting expectations — and uncertainty tends to produce conservative, slower treatment planning rather than confident case presentation. The minimum is a weekly or biweekly check-in that covers production per hour and case acceptance rate. Those two numbers tell the associate whether the problem is clinical volume, case presentation, or something else entirely.
Clinical mentorship frameworks in DSO environments have produced 18 to 22% production growth in documented cases. The infrastructure that drives that result isn't unique to a DSO. It's a clinical standard, a feedback loop, and consistent meetings — all of which a private practice owner can put in place without a Chief Dental Officer or enterprise software. If you're already seeing slow progress and want a more structured diagnostic, the associate production guide walks through how to identify which of these gaps is the primary driver.
Tracking the Right Metrics Through Each Phase of the Ramp-Up
The most common monitoring mistake owners make is pulling associate production numbers at the six-month review and realizing the trajectory has been flat for three of those months. A trajectory problem at month four is manageable; the same problem discovered at month nine requires a harder conversation about fit, structure, or whether the role is working at all. The difference between those two situations is whether you were watching the right numbers monthly.
Configure per-provider tracking in your practice management software before the associate's first day. Production, collections, case acceptance, and hygiene-to-restorative conversion should all be attributable by provider from session one. If you set this up after the fact, you'll be working from incomplete data at exactly the moment you need it most. It also signals to the associate from the start that performance is tracked and discussed, which sets a healthier expectation than introducing metrics only when something goes wrong.
Three numbers are worth pulling every month during the ramp-up.
Production per clinical hour is the clearest single indicator of momentum. A benchmark of $500 to $650 per hour is a reasonable target range for an associate building toward full production, with the expectation that early months will run below it as the schedule fills. Track this monthly, not as an annual average. If production per hour is flat from month three to month six, the problem is almost always scheduling density or case presentation, not clinical speed. If it's growing but slowly, the associate may need access to more complex cases or a block scheduling adjustment that reserves time for higher-value procedures rather than filling the day with small restorations. Your practice management KPI review should include this number for the associate as a separate line from the practice total.
Case acceptance rate tells you something production per hour can't. Track it separately from your own rate. A lower rate in months one through three is normal: the associate is building patient relationships from scratch, and patients who've never met them will take more time to move forward with treatment. A flat or declining rate after month four is a different signal. It usually points to case presentation approach, treatment planning calibration with the owner, or a mismatch between how the associate is communicating treatment and how your patient base responds to it. Seeing that number diverge from yours is what prompts the right conversation early.
Hygiene-to-restorative conversion is the most reliable leading indicator of schedule health. What percentage of the associate's restorative production is sourced from hygiene handoffs versus new patient exams? If the associate is primarily filling chairs through new patient work but not converting hygiene recalls into restorative appointments, the pipeline will eventually thin out. A healthy split means the associate is embedded in the practice's patient flow, not just handling overflow.
Reading these three metrics together gives you a clear picture of where the ramp-up actually stands: climbing production per hour and improving case acceptance point to a normal trajectory, growing production per hour with low hygiene conversion points to the scheduling structure, and lagging case acceptance while the other two are fine points to presentation rather than volume. Owners who are past the ramp-up window and dealing with persistent underperformance rather than a developing trajectory have a different problem to diagnose.
Sources & References
The data and claims in this article are drawn from the following sources. We prioritize government data, peer-reviewed research, and established industry publications to ensure accuracy.
- Dental Associate Ramp Time: How DSOs Accelerate Growth— www.speareducation.comIndustry
- How Much Should a General Dentist Produce Per Day?— www.mgeonline.comIndustry
- When to Hire an Associate: A Guide for Private Practice Dentists— parkhurstconsulting.comIndustry
- Dental Associate Compensation: Models That Protect Margins— nstarfinance.comIndustry
- How to Build Successful Dental Associates and Grow Your Practice— dentalpracticeheroes.comIndustry
- Improve Associate Production and Treatment Acceptance— deodentalgroup.comIndustry
- Dental Practice Growth: Financial Milestones from Solo to Multi-Provider— numetix.aiIndustry
- How to Build Successful Dental Associates and Grow Your Practice— dentalpracticeheroes.comIndustry
Put Your Associate's Ramp-Up on a Faster Track
Shortening an associate's production timeline starts with tighter scheduling, billing, and patient flow systems. Minty Operations handles the business side so your practice infrastructure supports a new provider from day one.