Dental Practice Payroll Percentage Too High: How to Fix It

Co-Founder, Minty Dental

Your Staffing Percentage Is a Fraction — and Either Half Can Be the Problem
Your dental practice staffing percentage is total team compensation divided by net production for the same period. That's it. When the number runs high, most owners assume the numerator is the problem and start thinking about wages, hours, or headcount. But the denominator moves too, and a production shortfall can push the ratio above benchmark just as easily as an overpaid team.
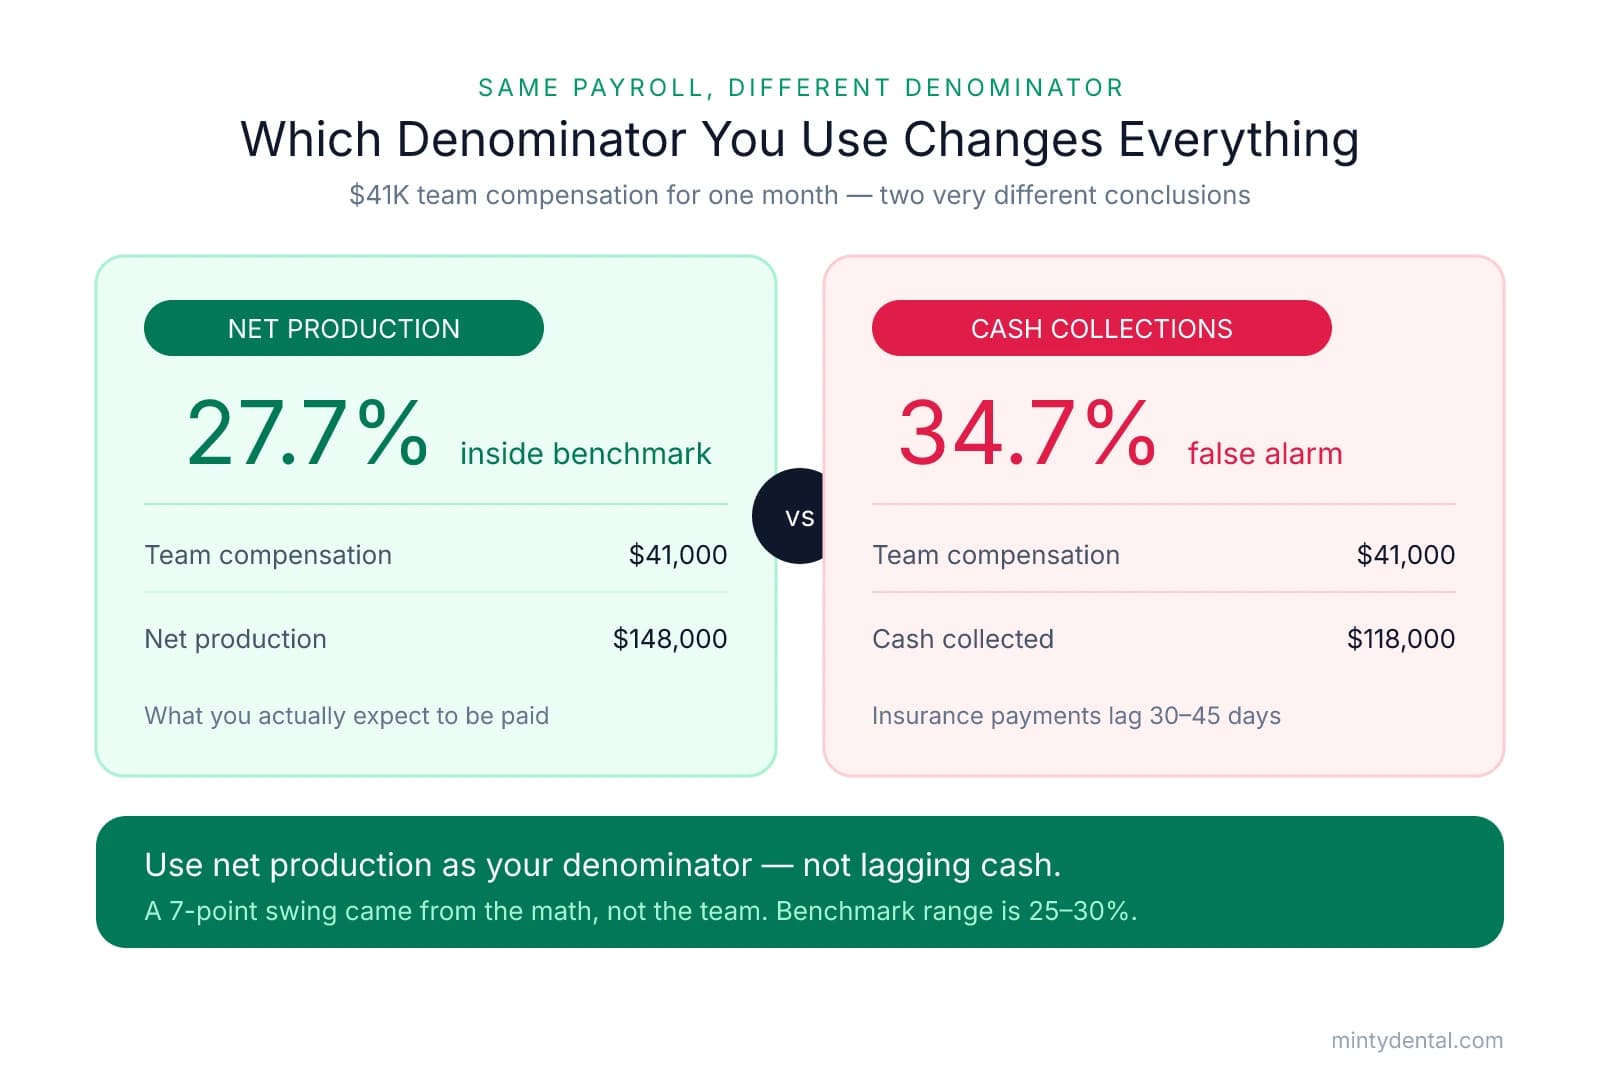
What belongs in each half of the fraction
The numerator is everything you spend on your team: base wages, part-time and overtime hours, employer-side payroll taxes (Social Security, Medicare, FUTA, SUTA), and any benefits you're covering — health insurance, retirement contributions, paid time off. Owners who calculate only base wages understate their true labor cost by several percentage points and then wonder why their P&L doesn't match the benchmark.
The denominator is where most practices make the critical error. Three figures all look like revenue on your reports:
| Denominator | What It Includes | Why It Distorts the Ratio |
|---|---|---|
| Gross production | Everything billed at full fee schedule | Overstates revenue you'll ever collect; makes the ratio look artificially healthy |
| Net production | Gross minus contractual insurance write-offs | Reflects what you're actually owed — the correct denominator |
| Cash collections | Payments received in the period | Understates revenue when insurance payments lag; inflates the ratio |
Gross production includes amounts you've already agreed to write off under your PPO contracts, while net production represents the dentistry you actually expect to be paid for. Cash collections is the most dangerous choice because insurance reimbursements routinely arrive 30 to 45 days after a claim is submitted. In a month where you delivered a lot of care and those insurance payments haven't landed yet, collections will run short of net production — and your staffing ratio will spike for a reason that has nothing to do with payroll.
A worked example
Say your practice carries $41,000 in total team compensation for the month. Gross production was $165,000, net production (after write-offs) was $148,000, and cash collections for the month were $118,000 because a batch of insurance payments is still in transit.
- $41K divided by $148K net production = 27.7% — squarely inside the benchmark
- $41K divided by $118K cash collected = 34.7% — looks like a staffing emergency
Same payroll, same team, same month. The only thing that changed is which denominator you used. If you're tracking this number against cash collections, you will occasionally generate a false alarm that sends you looking for a payroll problem that doesn't exist. This is the most common benchmarking error in dental practice financial management, and it's worth fixing in your reporting before you draw any conclusions.
The benchmark and what it means
The 25% to 30% range, published by the Academy of Dental CPAs and the National Society of Certified Healthcare Business Consultants, has held steady across practice types for years. A practice running at 25% is lean, which can reflect a productive team, reduced benefits, or a high-production provider mix. At 30% you should be able to point to something that explains it — a deeper hygiene department, a new hire still ramping up, or a recent wage adjustment. Anything above 30% is worth a closer look, but a single month above the line isn't a verdict.
The scale of the line is a useful anchor. On a practice with $1 million in net production, one percentage point equals $10,000 per year. That makes precision worthwhile when you're tracking key practice metrics month over month, but it also means a 31% month followed by a 28% month is a normal fluctuation, not a trend. Watch the rolling three-month average before drawing conclusions.
Three Root Causes Behind a Genuinely High Staffing Percentage
Once you've confirmed the number is real — calculated correctly, holding above 30% across three to six months — the next step is figuring out which part of the practice is driving it. There are three distinct root causes, and they require completely different responses. Treating a production problem like a payroll problem, or vice versa, is how owners make things worse.
Root cause 1: The denominator is low
This is the most frequently misdiagnosed situation. Your payroll isn't the problem — you just don't have enough production to support it. When individual wages sit at or below your local market rate but the percentage is still above 30%, the math is telling you something about the top line, not the cost structure.
Check three things: open time on the schedule, your no-show and cancellation rate, and hygiene utilization. A practice losing four or five hygiene appointments a week to last-minute cancellations is paying for capacity that produces nothing. If your schedule regularly has unfilled blocks, whether you even have enough hygiene days is the right question — not whether to cut staff.
Root cause 2: The numerator crept up
Hygienist wages grew 26.6% between 2018 and 2023, averaging roughly 5% per year. Over that same window, dental practice expenses grew 4.9% annually while revenues grew only 1.4% — a structural squeeze that compounds quietly. A practice that kept pace with the market on wages but didn't grow production proportionally ends up with a numerator that has outrun the denominator through no single bad decision.
Headcount drift is the other version of this. Practices that hired during a growth phase that didn't materialize — or added a role when a provider joined and then the provider left — often carry one or two positions the current schedule can't justify. Chronic overtime is a related signal: it sometimes looks like an understaffing problem when it's actually a scheduling or workflow problem being papered over with extra hours.
The secondary check here is the FTE-to-collections ratio. For a general practice, roughly one FTE per $170,000 in collections is a useful benchmark. A $1 million practice running eight FTEs is carrying more staff than the production level supports, regardless of what individual wages look like.
Root cause 3: The staffing mix is wrong
This is subtler than the other two. The headcount may be appropriate and the wages reasonable, but the structure doesn't match actual patient volume. Full-time employees at 40 hours per week are the right choice when the schedule reliably fills; they're expensive when patient flow is uneven and chairs sit idle on Thursday afternoons. Part-time coverage or cross-trained staff who can move between front-office and clinical support roles can carry the same functional capacity at a lower total cost.
For hygiene specifically, the target is roughly 10% of collections — but 13% isn't automatically a problem. A hygiene department running at 13% with full schedules and strong production per hour is a different situation than 13% with chronic open blocks. The wage percentage only tells you something meaningful when you read it next to schedule utilization and production per hour.
Fixing a Denominator Problem vs. a Numerator Problem
The fix depends entirely on which half of the fraction moved. Getting that wrong is expensive — cutting staff when production is the problem removes the capacity you need to grow your way out of it, which shrinks the denominator further and makes the ratio worse.
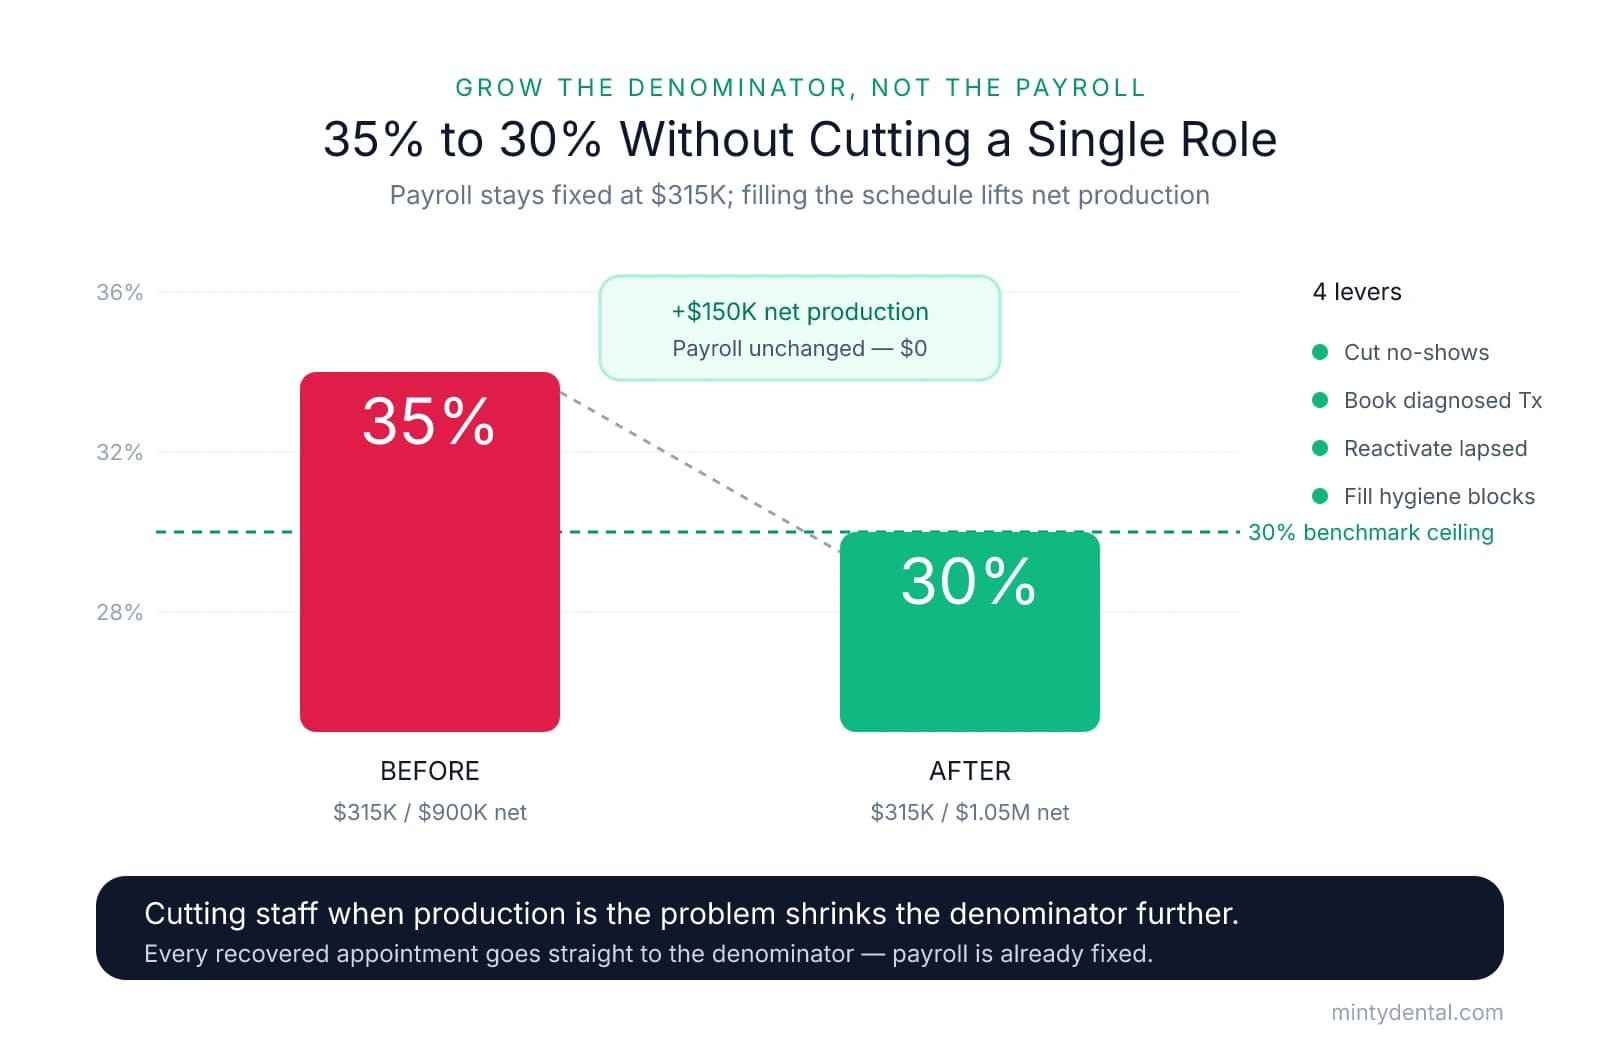
If the denominator is the problem: grow net production without touching payroll
The fastest way to improve your staffing percentage is to fill time that's already on the schedule. Your payroll cost is largely fixed across the week regardless of how many patients show up, so every appointment you recover goes straight toward the denominator.
- Reduce no-shows and last-minute cancellations. Missed appointments don't just cost revenue — overhead keeps running anyway, so the staffing percentage spikes for those hours without any offsetting production. A confirmation workflow with two-touch reminders and a short-notice waitlist fills most of that time.
- Convert unscheduled diagnosed treatment. Pull a report of treatment plans presented but not yet scheduled. Patients who have accepted a diagnosis but haven't booked are your highest-conversion opportunity because the case presentation is already done.
- Reactivate lapsed patients. Patients who haven't been seen in 18 months or more represent recovered production at no additional marketing cost. A targeted reactivation campaign run by your front desk during slower blocks is one of the highest-return uses of existing staff time.
- Fill open hygiene blocks. Hygiene production typically anchors 25% to 35% of practice revenue, and an open hygiene chair is the single most common driver of a denominator shortfall.
Here's what that looks like in practice. A hypothetical practice carries $315,000 in annual payroll and runs $900,000 in net production: 35%. By reducing no-shows, reactivating lapsed patients, and scheduling a backlog of diagnosed treatment, net production grows to $1,050,000 over the next year. Payroll doesn't change by a dollar. The staffing percentage drops to 30% on its own.
If the numerator is the problem: right-size wages and structure
When wages or headcount are genuinely out of proportion with production, the approach matters as much as the outcome.
- Use attrition before layoffs. When practices cut staff, most who reduced headcount did so through attrition rather than termination. Letting a departure go unfilled, or replacing a full-timer with a part-timer, avoids severance risk and morale damage.
- Shift full-time roles to part-time where volume supports it. A front-office position running 40 hours in a practice with uneven patient flow is a candidate for 28 to 32 hours. Part-time coverage can be added during peak blocks without carrying idle hours through the week.
- Cross-train staff to consolidate roles. A team member who can handle both insurance verification and checkout reduces your exposure when someone leaves and removes the justification for a dedicated single-function hire.
- Shift from automatic raises to collections-based bonuses. 72% of surveyed practices eliminated automatic across-the-board pay raises and replaced them with bonus structures tied to collections growth. Staff share in the upside when production rises, but fixed overhead doesn't creep up in slow years.
- Evaluate hygiene coverage model. Before committing to a full-time hygienist at 40 hours, look at your schedule utilization by day. A per-diem or part-time hygiene model matched to actual demand costs less than full-time wages for a partially-filled schedule.
- Outsource administrative functions. Billing and insurance verification can be handled externally, which reduces full-time front-office headcount without touching clinical capacity. If your collection rate is already slipping, outsourcing billing to a specialist often improves both metrics at once.
Running denominator and numerator fixes simultaneously when only one is indicated dilutes both strategies and delays the result.
Reviewing Your Staffing Percentage as a Monthly Habit
One month above 30% is a note, not a response. Insurance payment timing, a provider out for a week, or a holiday-shortened schedule can all push the ratio above benchmark without telling you anything about your underlying cost structure. The number becomes meaningful when it holds above 30% for three or more consecutive months. That's the signal worth acting on.
When you pull your monthly numbers, separate clinical payroll from administrative payroll before you calculate the ratio rather than tracking a single combined figure in isolation. If hygienists and assistants account for 22% of net production and your front office adds another 11%, you know immediately where the pressure is and which part of the schedule to examine first. Combining them into a single line obscures the diagnosis.
When a three-month trend confirms the ratio is running high, work through the diagnosis in order. First, confirm you're using net production as the denominator rather than lagging cash collections. Second, check the denominator before touching the numerator by pulling your schedule utilization rate, your no-show and cancellation rate, and your hygiene reappointment rate, which is often where the largest recoverable production is sitting. Only after the denominator checks out clean, with a well-utilized schedule and strong recall, should you examine headcount, hours, and compensation structure.
The staffing percentage belongs alongside your other monthly practice KPIs — collection rate, production per provider hour, and case acceptance. Read in that context, a rising staffing percentage usually points to something specific: open blocks building up, a recall system losing patients, or a front-office headcount that didn't contract after a provider left. On its own, it's just a fraction. Alongside the rest of the numbers, it tells you exactly where to look. The broader overhead picture matters here too — many general practices run total overhead near 75% of revenue, which leaves little room for staffing costs to drift before profitability is genuinely at risk.
Sources & References
The data and claims in this article are drawn from the following sources. We prioritize government data, peer-reviewed research, and established industry publications to ensure accuracy.
- Dental Practice Staffing Percentage: What It Tells You— reciprocityaccounting.comIndustry
- The 25% to 30% range— wa.nschbc.org
- Hygienist wages grew 26.6% between 2018 and 2023— fred.stlouisfed.org
- Trends in Dentistry: Maintaining a Successful Practice Amid ...— focuspartners.comIndustry
- Four Surprising Reasons Why a Dental Practice's Overhead May Be ...— www.pkfod.comIndustry
- Strategies to control labor costs in your dental practice - Dentistry IQ— www.dentistryiq.comIndustry
- Dentists: Is Your Practice's Overhead Too High? - Aprio— www.aprio.com
Cut Payroll Percentage by Fixing the Right Problem
Whether your staffing ratio is a wage problem or a production problem, Minty handles the billing, scheduling systems, and operational infrastructure that move your denominator in the right direction.