Dental Practice Seasonal Cash Flow: What Buyers Must Know

Co-Founder, Minty Dental

In Summary
- Virtually every dental practice has a seasonal revenue pattern — the buyers who get hurt aren't those who bought seasonal practices, but those who didn't know they had one
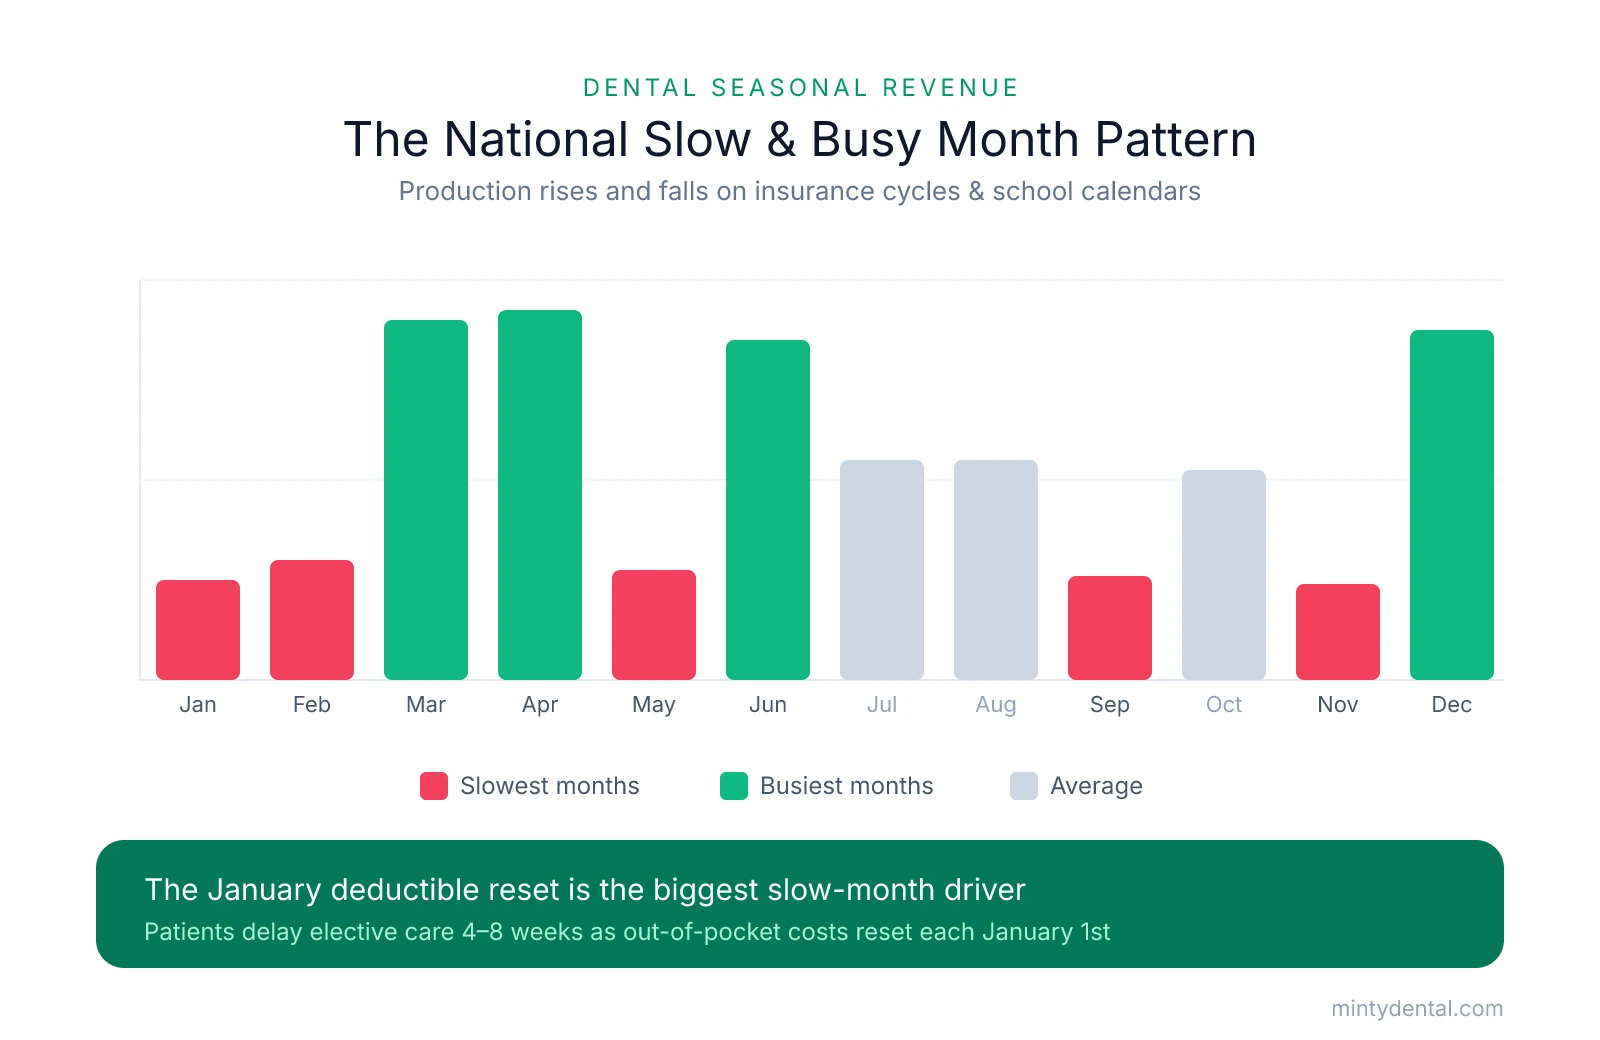
- Nationally, the slowest months for dental practices are January, February, May, September, and November; the busiest cluster in March, April, June, and December
- The January deductible reset is the single biggest structural driver of slow months — patients delay elective care for 4–8 weeks while their out-of-pocket obligations reset
- Local demographics can shift these patterns significantly — practices near schools, retirement communities, or tourist areas often follow a completely different rhythm
- Seasonality is predictable and plannable — the right response is due diligence, not avoidance
Seasonal Cash Flow Is Normal — But It Can Blindside a New Owner
Dental practice seasonal revenue: Virtually every dental practice in the U.S. follows a predictable seasonal rhythm — production rises and falls in patterns tied to insurance cycles and school calendars, not to how well the practice is run. The buyers who run into cash flow trouble aren't those who bought seasonal practices. They're the ones who closed without realizing they had one.
That distinction matters, because seasonality is manageable when you see it coming. It becomes a crisis when you don't.
The national pattern is well-documented. According to Dental Products Report, the busiest months are March, April, June, and December — spring months when families schedule ahead of summer, and year-end when patients rush to use remaining insurance benefits. The slowest months cluster in January, February, May, September, and November.
Two structural forces drive most of this pattern. The first is the January insurance deductible reset. On January 1st, patient out-of-pocket obligations reset — and with HDHP minimum deductibles now reaching $1,700 for individuals, many patients delay elective care until they feel financially ready. The result is suppressed appointment volume that typically runs 4–8 weeks into the new year. For a buyer who closes in December and takes over in January, this isn't a warning sign about the practice — it's a calendar event that happens every year, everywhere.
The second driver is school-year scheduling. Families concentrate dental visits around the academic calendar — spring before summer break, early fall before routines lock in. The gaps in between (late May, September) tend to be quieter.
Local demographics can amplify or completely reshape these national patterns. A practice near a large school district may see sharper spring peaks and steeper summer drops. A retirement-community practice may barely register the school-year effect but show stronger sensitivity to snowbird migration. A coastal or mountain practice serving a tourist economy might run almost inverse to the national curve.
This is why pulling monthly production data — not just annual totals — is one of the more valuable steps in evaluating any practice. Learning to read a dental practice P&L at the monthly level is what separates buyers who understand what they're acquiring from those surprised by their first slow quarter.
Seasonality isn't a reason to walk away. It's a due diligence category — one that most buyers skip entirely.
How to Read a Practice's Seasonal Pattern Before You Close
The challenge with annual financials is that they're designed to summarize — and summarizing is exactly what hides seasonality. A practice collecting $1.2M annually looks stable on a tax return. That same practice might collect $140K in March and $70K in January, and you'd never know it from the year-end number alone.
One of the more important requests you can make early in due diligence is for month-by-month production and collections reports going back at least three years. Most practice management software generates these in minutes. If a seller hesitates, that hesitation is itself worth noting.
What Three Years of Monthly Data Actually Tells You
Once you have the reports, you're looking for three distinct patterns — each requiring a different response:
Consistent dips in the same months across all three years signal normal seasonality. January slow, March strong, January slow again — that's a calendar pattern, not a practice problem. It's plannable.
Dips that deepen year-over-year are a different story. If January collections were down 18% from average in year one, 24% in year two, and 31% in year three, that trajectory points toward structural decline — eroding patient loyalty, a referral problem, or demographic shift. This warrants a much closer look at new patient flow trends before proceeding.
Dips that don't recover suggest patient attrition, not seasonality. A practice that dips in January and rebounds in March is healthy. One that dips in January and stays flat through April has likely lost those patients permanently — they rescheduled elsewhere and didn't come back.
Calculate the Seasonal Spread
A simple calculation gives you a quick read on how volatile the practice really is:
Seasonal spread = (Best month − Worst month) ÷ Average monthly production × 100
A 20–30% swing is common across most general practices and entirely manageable with modest working capital planning. A spread above 50% warrants deeper investigation — it may still be explainable, but understanding why before closing matters.
| Year | Best Month | Worst Month | Monthly Average | Spread |
|---|---|---|---|---|
| 2022 | $128,000 (Mar) | $84,000 (Jan) | $104,000 | 42% |
| 2023 | $131,000 (Mar) | $86,000 (Jan) | $106,000 | 42% |
| 2024 | $134,000 (Apr) | $88,000 (Jan) | $108,000 | 43% |
That's a consistent, stable pattern — the spread holds, the recovery is predictable, and the overall trend is modestly positive. That's a practice you can plan around.
Check Hygiene Schedule Utilization by Month
One metric often overlooked in this analysis is hygiene schedule utilization by month. Hygiene is the most stable revenue stream in most practices — driven by recall appointments booked weeks in advance, not same-week treatment decisions. When hygiene utilization dips sharply in slow months, it suggests patients are canceling or not rebooking, which is a patient loyalty signal worth taking seriously. A high no-show or cancellation rate concentrated in certain months can quietly distort your seasonal picture.
The Seller's Preferred Closing Date Is a Data Point
Pay attention to when a seller wants to close. A seller pushing for a January or February close may want the trailing twelve months to include a strong spring and fall — presenting the most favorable collections picture possible. Closing in a slow month can also create an immediate cash squeeze before you've had a chance to build any operating rhythm. The ADA's guidance on practice transitions notes that a short listing-to-close window is often in the seller's interest, which can also compress the data window available to you as a buyer.
A slow-month close isn't always wrong — but it's worth factoring into how you negotiate the final terms and how much working capital you plan to have on hand at close.
Sizing Your Working Capital Reserve for Slow Months
With the seasonal pattern mapped, the next question is concrete: how much cash do you actually need in reserve to get through slow months without stress? Here's a step-by-step process for calculating that number.
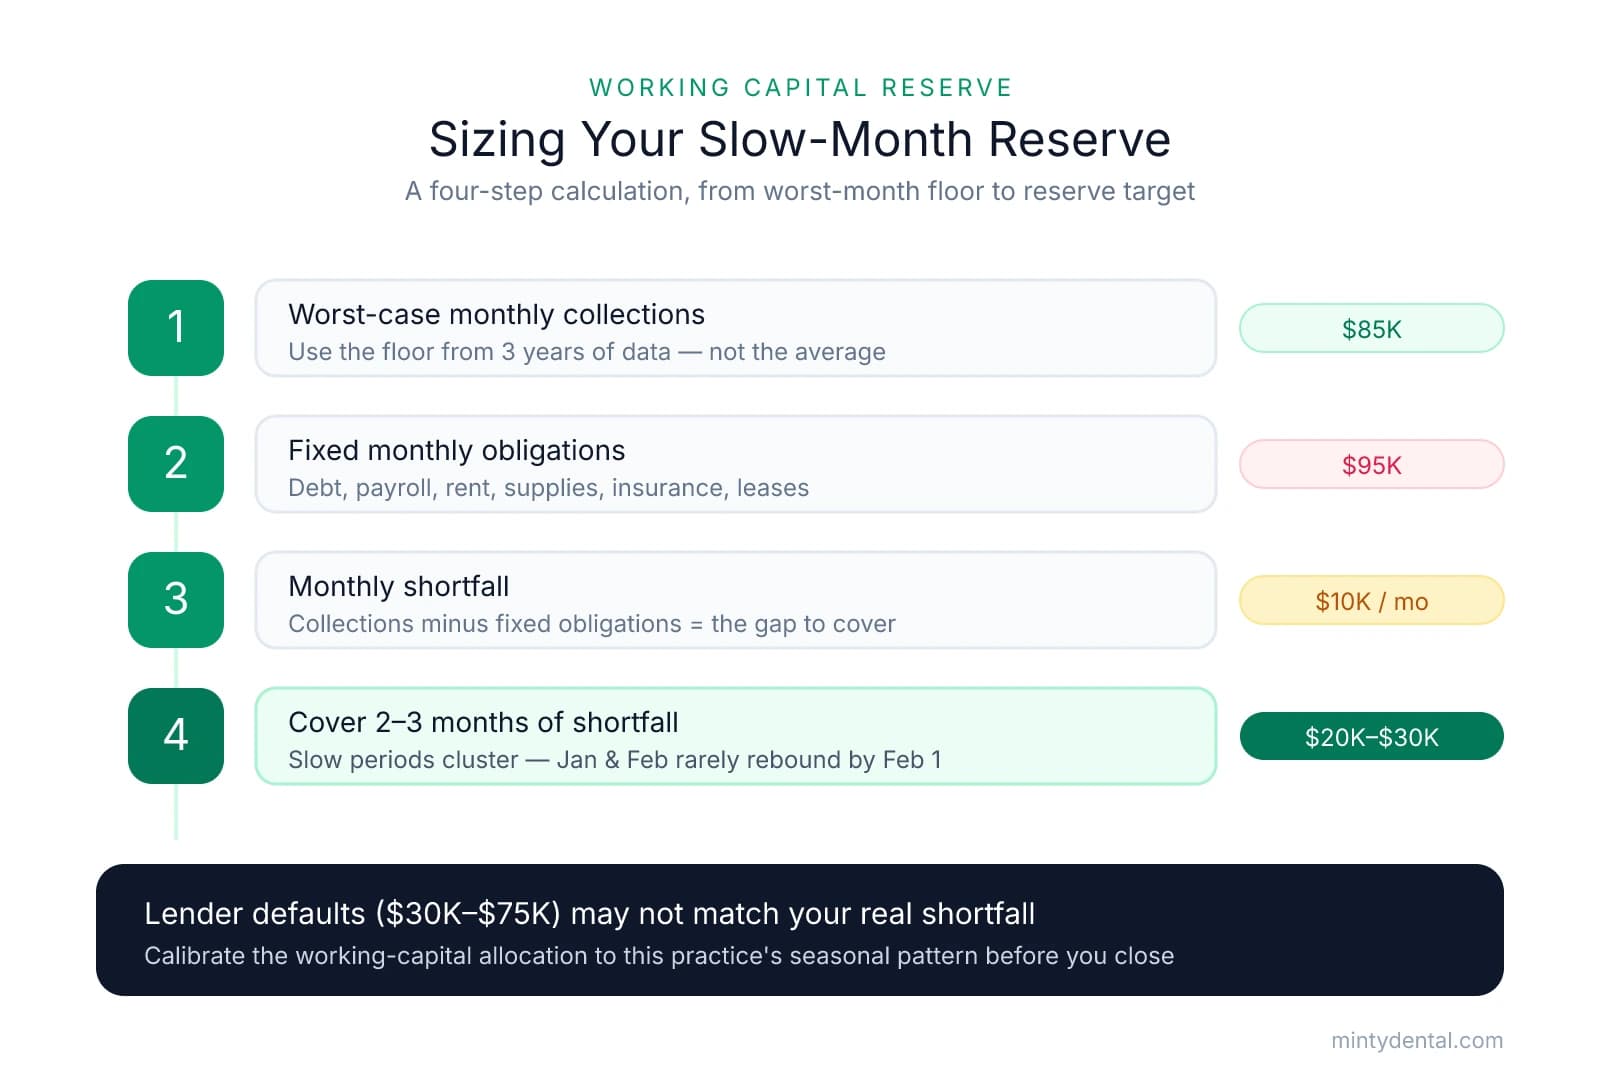
Step 1: Identify your worst-case monthly collections. Pull the lowest-collecting month from each of the three years of data. Don't use the average — use the floor. If January ran $84K, $86K, and $88K across three years, your planning baseline is roughly $85K.
Step 2: Calculate your fixed monthly obligations. Add up every obligation that doesn't flex with revenue: debt service, payroll, rent, supply orders, insurance, and equipment lease payments. This is your break-even floor.
Step 3: Calculate the monthly shortfall. Subtract fixed obligations from worst-case collections. If floor collections are $85K and fixed obligations total $95K, your monthly shortfall is $10K — the gap your reserve needs to cover.
Step 4: Size the reserve to cover 2–3 months of that shortfall — not one. Slow periods tend to cluster. January and February often both run light, and a practice that dips in January rarely snaps back by February 1st. Two to three months of shortfall coverage is the more realistic target.
Most dental acquisition lenders include working capital in the loan — typically $30,000–$75,000, per YHB's practice acquisition financing guidance. The problem is that figure is often a lender default, not a number calibrated to the specific practice's seasonal pattern. It's worth having a direct conversation with your lender about whether the working capital allocation actually covers your calculated shortfall — and if the approval process is running long, revisit the structure using this guide to slow dental practice loan approvals.
Closing timing matters more than most buyers expect. Closing in October means January — often the worst collections month — arrives within 90 days of ownership, before you've had a chance to build any operating rhythm or cash buffer. Factor this into your close date negotiation.
One pattern worth building early is the cash buckets approach: separating operating cash, owner draw, tax set-aside, and reserve into distinct accounts. The reserve gets quietly consumed when it sits alongside operating funds. Model your personal draw based on worst-month collections, not the annual average — slow months are not the time to pull from the buffer you built to protect the practice.
Turning Slow Months Into an Advantage After Closing
Here's the shift that separates prepared buyers from reactive ones: the seller you're buying from has spent years surviving slow months. You have the opportunity to schedule them.
That reframe is operational, not just motivational. When you've already mapped the dip against your debt service and overhead, the slow month stops functioning like a warning sign and starts functioning like a planned maintenance window.
Three Ways to Put Slow Months to Work
Use the downtime for investments that would disrupt a full schedule. Staff training, CE courses, software migrations, and equipment upgrades all carry a hidden cost when scheduled during peak months: chair time. A slow January is the right moment to run your team through updated protocols or evaluate your practice management system. The revenue dip is real — but so is the opportunity cost of trying to do this work in March.
Time marketing and hygiene reactivation campaigns to land 3–4 weeks before the slow period ends. If your data shows February as the floor and March as the recovery, reactivation outreach should go out in early-to-mid February — not after the schedule already looks thin. As Dental Economics notes, timing with the seasons works far better than fighting them. Patients who receive a recall reminder in February book into March.
Use the revenue dip as a prompt to review overhead and vendor contracts. Fixed costs feel most painful when revenue is light — which makes slow months the psychologically right moment to renegotiate them. Pull recurring vendor agreements, software subscriptions, and supply contracts. A conversation with a supplier during a slow period often lands differently than the same conversation in a busy spring month.
The Psychological Dimension
Many new owners experience their first slow month as quiet panic — a creeping sense that something is wrong with the practice they just bought. That feeling is completely understandable, and it's one of the more common contributors to imposter syndrome in early ownership. Knowing the pattern in advance doesn't eliminate the discomfort, but it converts it from an alarm into a calendar event.
The One Document That Changes Everything
Before closing, build a 12-month cash flow projection that maps the practice's historical seasonal pattern onto your post-acquisition debt service and overhead — month by month. Layer in your fixed obligations, your calculated shortfall from the worst months, and your reserve balance. That single document is the difference between a slow month feeling like a crisis and feeling like a scheduled maintenance window.
Seasonal practices aren't a risk category to avoid. They're a planning problem to solve — and you now have the framework to solve it before you sign.
Sources & References
The data and claims in this article are drawn from the following sources. We prioritize government data, peer-reviewed research, and established industry publications to ensure accuracy.
- How seasonality affects revenue in the dental practice— dentalproductsreport.comIndustry
- Deductible Reset in January: Strategies to Protect Your Revenue— billflash.comIndustry
- What to Do When Selling a Practice— www.ada.orgIndustry
- Practice Acquisition Financing: What Dental and Medical ...— yhbcpa.comIndustry
- Seasonality in dentistry— www.dentaleconomics.comIndustry
Ready to navigate seasonal cash flow challenges?
Understanding seasonal patterns is crucial when acquiring a dental practice. Minty's acquisition experts guide you through evaluating cash flow stability and structuring deals that account for revenue fluctuations.