Dental Practice Seller Reduced Hours Before Listing: Valuation Impact

Co-Founder, Minty Dental

In Summary
- A seller who scaled back to 2–3 days per week before listing will show declining collections — but that doesn't mean the practice itself is declining
- The critical diagnostic question is whether the practice lost patients or simply lost chair time; these require completely different buyer responses
- The ADA has noted that sellers who reduce production before selling will see collections fall, staff may leave, and patients may seek care elsewhere — compounding the distortion over time
- The trailing 12 months of collections — typically the headline number in a listing — will be the most distorted figure in a reduced-hours scenario; buyers should analyze the full 3-year arc
- A seller working 2 days per week is a significant outlier: ADA data shows owner dentists work roughly 5 more hours per week than associates on average
Declining Collections Don't Always Mean a Declining Practice
A suppressed practice versus a declining practice: a suppressed practice shows falling collections because the owner reduced their clinical hours — not because patients left, the market weakened, or operations deteriorated. A declining practice shows falling collections for the opposite reasons. These two scenarios can look identical on a listing sheet and require completely different responses from a buyer.
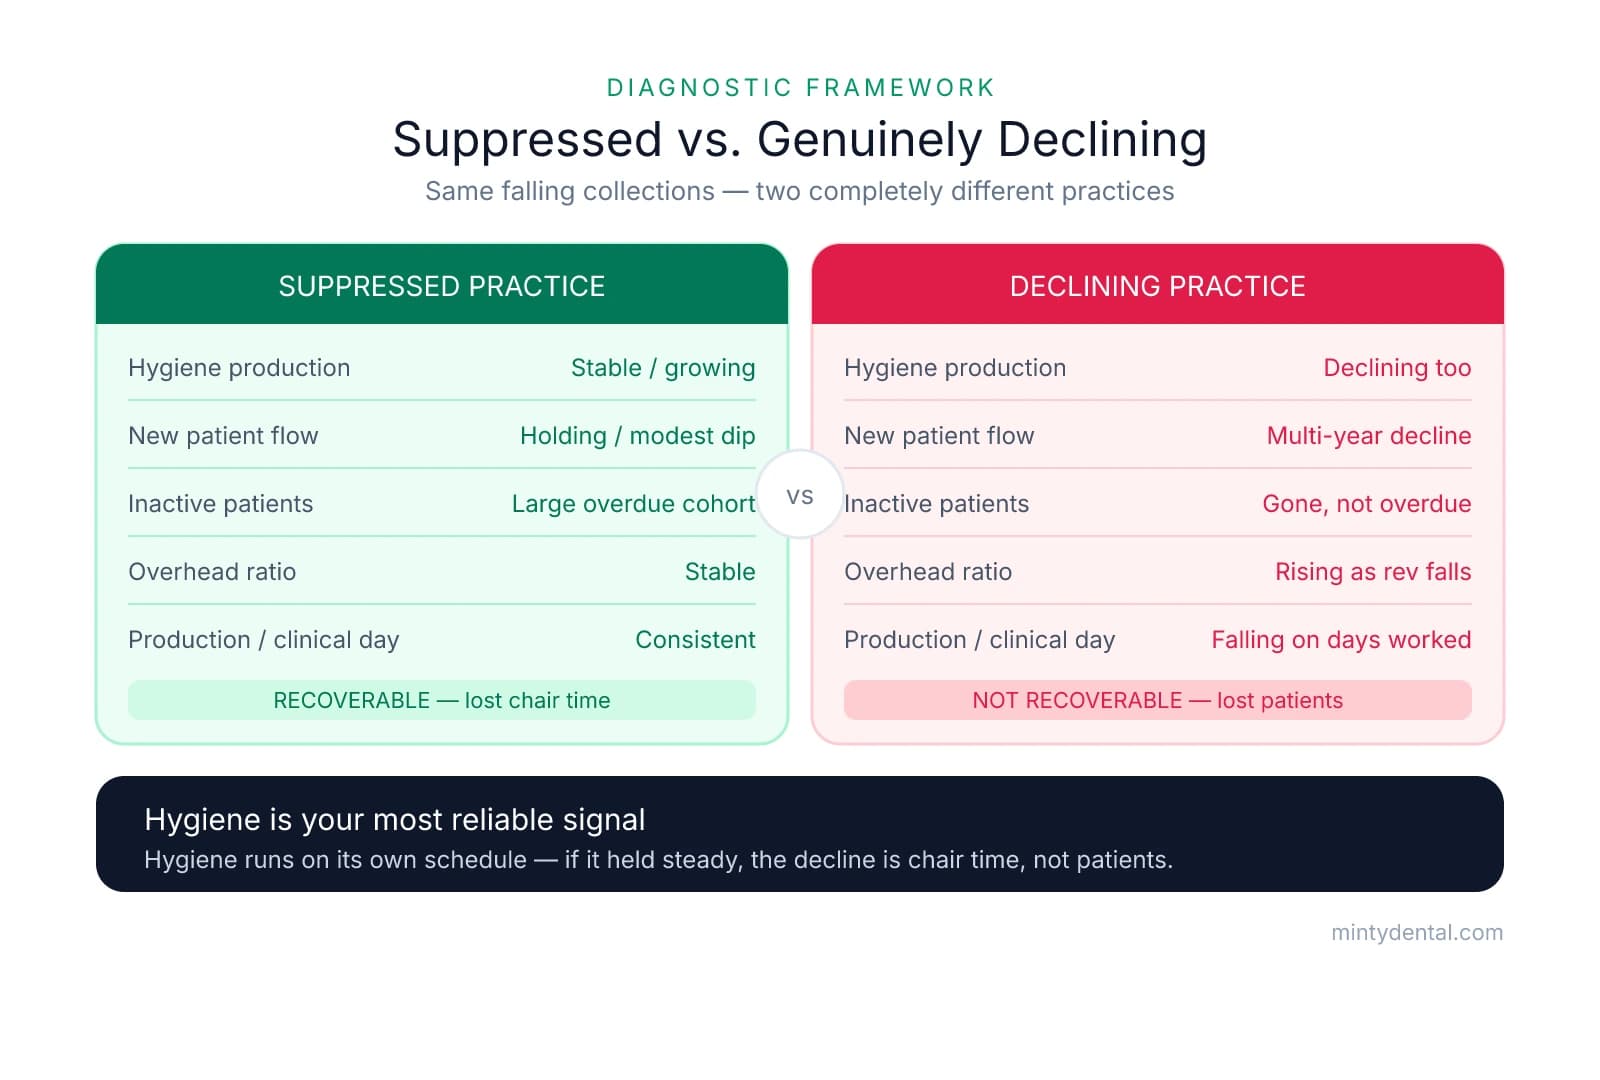
This distinction is one of the most misread dynamics in dental practice acquisitions. A seller who worked five days a week for twenty years, then scaled back to two days a week for the past two years before listing, will produce a collections trend that looks troubling at first glance. Revenue is down. The trailing twelve months — often the headline figure in a broker's offering memorandum — reflects the most compressed production period of the seller's entire career. Without context, that number tells a story of a practice in trouble.
That story may be wrong.
The ADA has flagged this dynamic explicitly: sellers who scale back production before listing will see their bottom line decrease, staff may leave if they're not needed, and patients will seek care elsewhere when they can't be seen in a timely manner — all of which compounds over time and depresses the sale price. What the ADA is describing is a practice artificially suppressed by an owner winding down, not one that lost its footing in the market.
The scale of that suppression matters. ADA data shows owner dentists work roughly five more hours per week than associates on average. A seller working two days a week isn't just below that norm — they're a significant outlier. Spread that production gap across two years, and the cumulative distortion in the financials can be substantial.
Two questions anchor everything that follows in your analysis:
- Did the practice lose patients, or did it lose chair time? Patient attrition and schedule compression both reduce collections, but only one leaves you with a recoverable asset.
- Are the patients still in the system, or have they left? Active patient count, recare compliance rates, and hygiene retention data will tell you more than any single revenue figure.
The trailing twelve months of collections will be the most distorted number in this scenario — and it's usually the one that anchors the listing price conversation. Before accepting that number at face value, or walking away because it looks soft, the more productive move is to pull the full three-year arc and ask what actually changed: the practice, or the schedule.
How to Read the Financials When the Seller Wound Down
The trailing 12 months of production is the number brokers and lenders lean on most heavily — and in a reduced-hours scenario, it's the most misleading figure in the file. It captures the seller at their least productive, often reflecting a schedule that bears no resemblance to how the practice operated for the decade before it. A more reliable approach is to weight the three-year average more heavily and map the year-over-year trend to understand when the decline started and how fast it accelerated. A practice that held steady for two years and then dropped sharply in the last 12 months tells a very different story than one that's been eroding gradually.
Start by requesting production-by-provider reports broken out by month for the past three years — most practice management systems generate these directly. This isolates the owner's personal production decline from overall practice performance, which is the core diagnostic question. If you're working through the broader P&L at the same time, the framework in this guide to reading a dental practice P&L can help you layer the production data into the full financial picture.
The Hygiene Department as Your Most Reliable Signal
Hygiene production is largely independent of how many days the owner works. Hygienists run their own schedules, and recare systems operate on their own cadence. That independence makes hygiene the most reliable leading indicator in a reduced-hours scenario.
If hygiene held steady while doctor production fell, the patient base is very likely intact — the decline is schedule-driven, not patient-driven. If hygiene also declined, that's a more serious signal: patients may have left the practice, not just the doctor's chair.
| Indicator | Suppressed Practice | Genuinely Declining Practice |
|---|---|---|
| Hygiene production trend | Stable or growing | Declining alongside doctor production |
| New patient flow | Holding or modest dip | Consistent multi-year decline |
| Inactive patient count | Large overdue cohort | Patients gone, not just overdue |
| Overhead ratio | Stable | Rising as revenue falls |
| Doctor production per clinical day | Consistent with prior years | Falling even on days worked |
Normalizing the Earnings
The seller's reduced schedule creates a form of artificial suppression — the practice's capacity hasn't changed, only the owner's utilization of it. Normalized SDE in this scenario should reflect what a full-time owner-operator would produce, not what the winding-down seller actually produced. This is a legitimate normalization, and lenders will generally accept it when it's supported by production-per-day data rather than assumptions.
To calculate implied full-schedule production: pull the seller's average production per clinical day from their peak years, then multiply by the number of days they stopped working. That gap is the suppressed revenue — and it's the number that should anchor your valuation conversation, not the trailing 12-month total.
The Inactive Patient Report
Request a report of patients not seen in the past 18–24 months and compare it to the prior period. A large overdue cohort isn't necessarily permanent attrition — it may represent a reactivation opportunity. According to Practice Analytics, approximately 35–40% of patients inactive for 9–24 months will make and keep a hygiene appointment when contacted directly. Patients who are overdue but still in the system are recoverable. Patients who transferred their records elsewhere are not. The inactive report tells you which situation you're actually in.
What Reduced Hours Do to Lender Underwriting — and Your Offer
Once you've worked through the financial diagnostics, the next challenge is practical: how does a lender see this practice, and what does that mean for your offer?
Most dental lenders — whether SBA 7(a) or conventional — underwrite on recent cash flow, typically the trailing 12 to 24 months. That's the same period most distorted by a seller's reduced schedule. A practice that generated $900K annually for a decade but collected $650K over the past two years will be underwritten closer to $650K, regardless of what the seller's broker says the "normalized potential" looks like. The lender is pricing the loan on what the practice actually produced while you were buying it — not what it could produce once you're running it full-time. As the ADA notes on the practice loan process, lenders will want to understand the practice's financial information in detail — and recent actuals carry significant weight in that conversation.
This creates a gap that catches many buyers off guard. The seller (and their broker) may be pricing on a three-year average or on normalized potential. The lender is pricing on recent actuals. Running both calculations yourself before making an offer helps you understand the spread — because that spread is often where the deal structure lives.
A two-year declining trend also triggers additional lender scrutiny. Expect requests for a letter of explanation, more detailed production reports, and potentially a lower loan-to-value ratio. Some lenders will discount the approved amount further to account for the perceived risk of a practice in transition. That's not a deal-killer — but it does mean the financing gap between asking price and lender-approved amount may be larger than on a stable practice at the same collections level.
Turning the Gap Into Negotiating Leverage
The reduced-hours scenario is legitimate grounds for a price adjustment — not because the practice is broken, but because you're absorbing the production rebuild risk. A seller who wound down over two years handed that risk to the buyer. The deal structure should reflect it.
Three structures worth considering:
- A lower purchase price anchored to recent actuals, with the seller's "normalized potential" argument acknowledged but not priced in — that upside belongs to the buyer who does the work of rebuilding it
- A seller note tied to first-year production milestones, which keeps the seller financially invested in a successful transition rather than cashing out entirely at closing
- A modest earnout, where a portion of the purchase price is contingent on collections reaching a defined threshold within 12–18 months — this shifts some of the recovery risk back to the seller while preserving upside for both sides
The mechanics of presenting these adjustments after due diligence are covered in detail in this guide to negotiating a price reduction.
The Transition Agreement Matters More Here
One risk that often goes unaddressed: a seller who reduced hours before listing may have limited motivation to stay and help reactivate patients after closing. They've already mentally exited. If the transition agreement allows them to show up two days a week for 60 days and call it done, the reactivation work falls entirely on the buyer.
A well-structured post-closing employment agreement should define not just duration but specific responsibilities — patient introductions, recare outreach, and defined clinical days. When structured carefully, this protects both sides and keeps expectations aligned from day one.
Turning the Reduced-Hours Practice Into a Day-One Growth Story
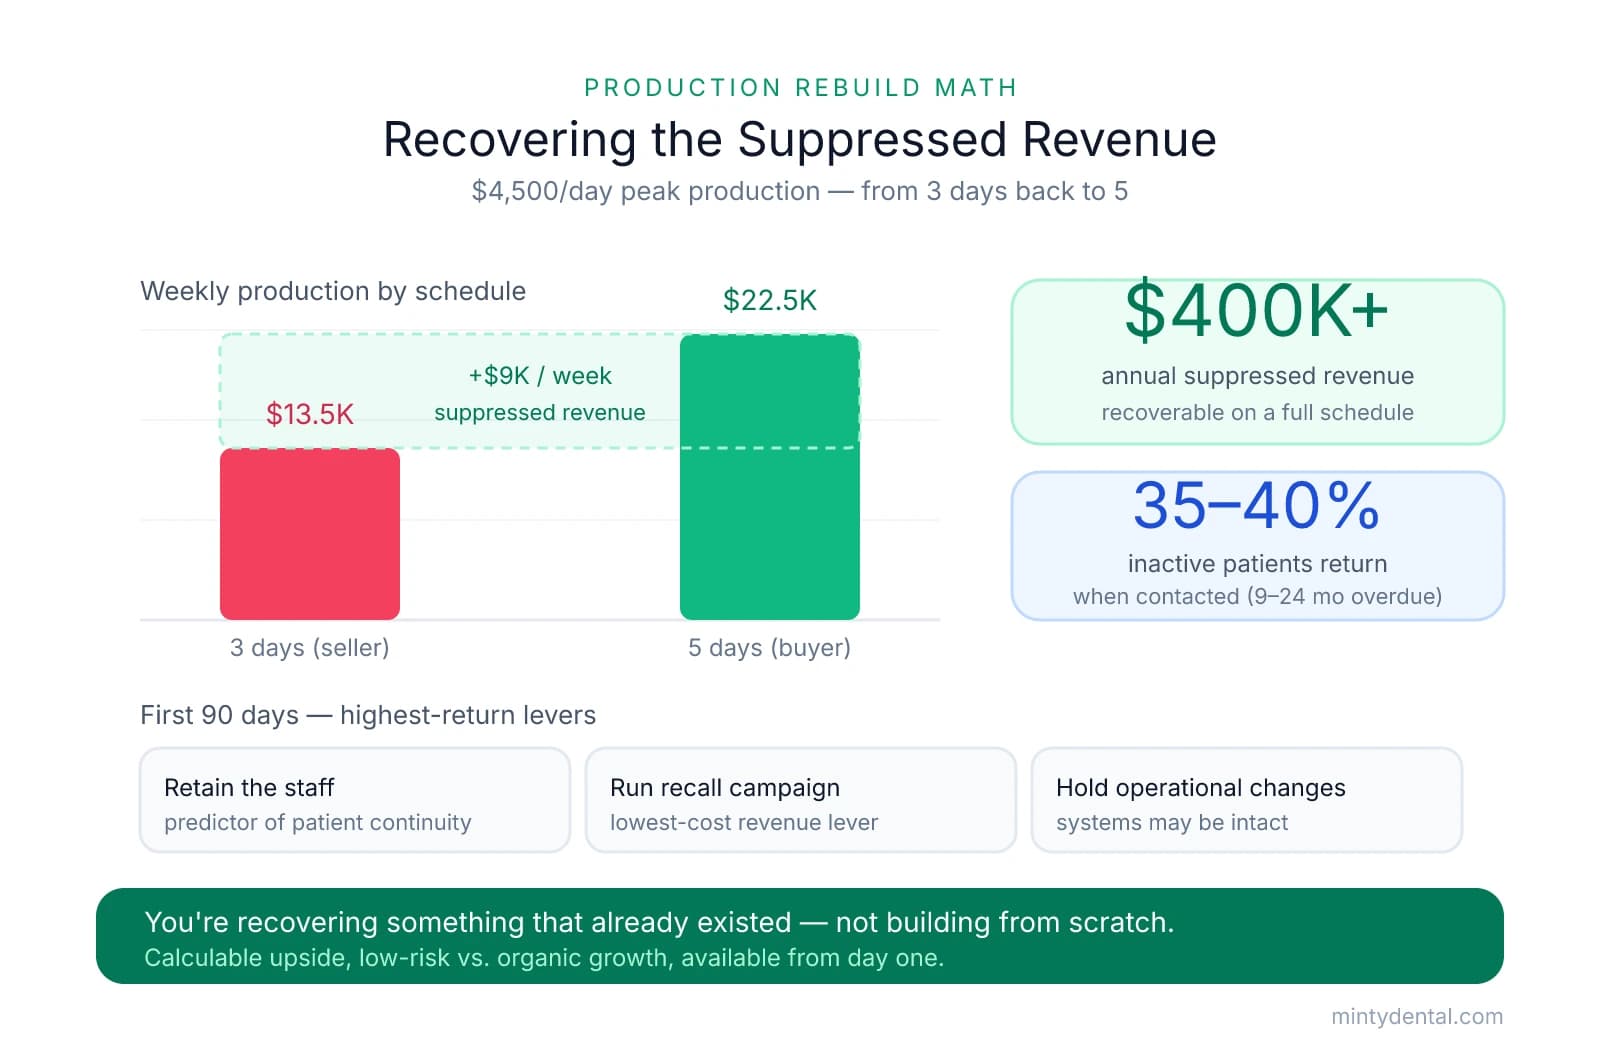
If the diagnostic work confirms what you're hoping to find — hygiene stable, patient base intact, decline clearly tied to schedule compression — the picture shifts considerably. You're not buying a troubled practice. You're buying a practice priced on suppressed revenue, with a calculable path back to full production simply by working a full schedule.
That's a meaningfully different risk profile than new patient acquisition.
The Production Rebuild Math
Start with the seller's historical production-per-clinical-day from their peak years. If they averaged $4,500 per day and dropped from five days to three, the suppressed revenue is roughly $9,000 per week — or somewhere north of $400,000 annually. When you step in at four or five days per week, you're not building something new. You're recovering something that already existed, with an existing patient base, existing staff, and existing systems.
That's the core of the opportunity. The upside is calculable, relatively low-risk compared to organic growth, and available from day one.
The Hygiene Reactivation Window
The fastest revenue lever in your first 90 days isn't new patient marketing — it's the overdue patients already sitting in your practice management system. According to Practice Analytics, approximately 35–40% of patients inactive for 9–24 months will make and keep a hygiene appointment when contacted directly. Those patients already know the practice, already trust the staff, and require no acquisition cost to bring back.
A structured recall campaign in the first 60–90 days — targeting patients overdue 12 to 24 months — is often the single highest-return activity a new owner can run. And because hygiene reappointments frequently lead to restorative treatment, the downstream production impact compounds quickly.
One protection worth building into the purchase agreement before closing: a patient retention guarantee tied to active patient count at closing. The reduced-hours period may have quietly eroded the active base in ways that don't surface in trailing collections — a retention clause shifts some of that risk back to the seller if the count falls below an agreed threshold post-closing.
What to Prioritize in the First 30–60 Days
- Retain the staff. Employees who stayed through reduced hours and income uncertainty chose the practice, not just the seller. That loyalty is a genuine asset — and patient retention research consistently shows that familiar staff are one of the strongest predictors of patient continuity after a sale.
- Run the recall campaign. Overdue patients are your lowest-cost revenue opportunity. Prioritize outreach before investing in external marketing.
- Hold off on operational changes. The practice's systems may be more intact than the financials suggest. Understand what's working before changing it.
The reduced-hours practice is neither automatically a bargain nor automatically a red flag. It's a diagnostic challenge — and buyers who do the analytical work to separate schedule compression from genuine decline are the ones who find real value where others see only risk.
Sources & References
The data and claims in this article are drawn from the following sources. We prioritize government data, peer-reviewed research, and established industry publications to ensure accuracy.
- 5 Years Out? How to Sell Now and Retire Later— www.ada.orgIndustry
- The Impact of Hygiene Reactivation - Practice Analytics— practiceanalytics.comIndustry
- The Truth about Dental Practice Loans— www.ada.orgIndustry
- Patient Retention Following a Dental Practice Sale— dentaltransitions.comIndustry
Ready to acquire a practice strategically?
Understanding valuation challenges helps buyers identify opportunities in the market. Minty's acquisition guidance walks you through evaluating practices at every stage, from initial search through closing.