Which Insurance Plans Are Dragging Down Revenue Per Procedure

Co-Founder, Minty Dental
In Summary
- Revenue per procedure by plan measures what your practice actually collects per dollar billed to a specific carrier after contractual adjustments, not just gross production or patient count.
- Two plans can each generate $200K in gross production while one nets $140K and the other nets $110K, a $30K difference that disappears inside a practice-wide write-off total.
- Dental reimbursement rose only 19% from January 2021 to Q2 2026 while inflation hit 27% and supply and staff costs rose 23%, narrowing the margin for carrying any plan that pays poorly.
- More than half of dentists cited low insurance reimbursement as their top practice challenge for 2026, up from prior years.
- Two reports already in your practice management software, the Insurance Carrier Production Report and the PPO Write-Offs/Contractual Adjustments Report, can isolate which specific plans are responsible.
Your Practice-Wide Write-Off Total Hides Which Plans Are the Problem
Revenue per procedure by plan is what your practice actually collects per dollar of gross production billed to a specific carrier, after contractual adjustments are applied. It's different from patient volume, gross production share, or anything you'd find on a summary dashboard.
Most practice management software surfaces a single write-off total, or at best a practice-wide write-off percentage. That number tells you something is wrong. It doesn't tell you where. Two plans can each represent $200K in gross production for the year, identical on every summary report, yet produce very different results when you look underneath. If Plan A nets $140K after adjustments, its write-off rate is 30%. If Plan B nets $110K, the write-off rate is 45%. The $30K gap between them is real money, but it's completely invisible in aggregate reporting. It gets averaged into the practice-wide figure and disappears.
That kind of variation matters more now than it did a few years ago. Dental reimbursement rates rose only 19% between January 2021 and Q2 2026, while general inflation reached 27% and dental supply and staff costs climbed 23%. The gap between what plans pay and what it costs to run a practice has widened, and that leaves less room to carry a plan whose fees haven't kept pace. A write-off rate that felt manageable in 2019 hits differently when your lab fees, supply costs, and hygiene wages have all moved up faster than your contracted rates.
The frustration is widespread. More than half of dentists, 55%, identified low reimbursement in Q4 2025 as their top practice challenge heading into 2026, making it the leading concern. What that number doesn't capture is how unevenly the problem is distributed across plans inside a single practice. For many owners, one or two plans account for a disproportionate share of total write-offs while others in the same payer mix perform reasonably well. The practice-wide percentage obscures that entirely.
Separating the signal from the noise requires getting off the summary report and down to the plan level. If you've ever looked at a high write-off percentage and wondered which plans are actually driving it, the answer is in two reports you almost certainly already have access to.
Two Reports That Show Net Reimbursement by Plan
Your practice management software almost certainly has both reports you need. The challenge is knowing what they're called and how to combine them.
Step 1: Pull the Insurance Carrier Production Report.
In Dentrix Enterprise, this report lives under DXOne Reports in the Office Manager, then Management, then Insurance Carrier Production. The report breaks out production billed to each carrier by primary and secondary insurance, alongside the insurance payments received for that carrier. Eaglesoft has an equivalent under its insurance reporting section. Open Dental calls it something slightly different depending on your version, but the same underlying data is available through the Procedures by Insurance report or the claims-based production views.
Set the date range to a full 12 months. Anything shorter introduces seasonal noise, since a plan that covers a lot of orthodontics or implants may look different in Q1 versus Q4. Filter to primary insurance only. If you include secondary claims, the same procedure gets counted twice, which inflates both production and payment figures and distorts every rate you calculate downstream.
Step 2: Pull the PPO Write-Offs or Contractual Adjustments Report.
This report isolates the contractual adjustments posted against each carrier rather than combining them into a single practice-wide figure. In Dentrix it's typically found under the Adjustment report filtered by adjustment type. Open Dental labels this the "Adjustment by Insurance" report. Eaglesoft surfaces similar data through its write-off analysis or adjustment summary reports. The name varies, but you're looking for the same thing: a carrier-by-carrier breakdown of contractual adjustments posted during the same 12-month window you used in Step 1.
Step 3: Calculate write-off rate and net reimbursement rate per plan.
Once you have both reports in front of you, calculate two figures for each carrier:
Write-off rate = contractual adjustments divided by gross production for that carrier. Net reimbursement rate = insurance payments received divided by gross production for that carrier.
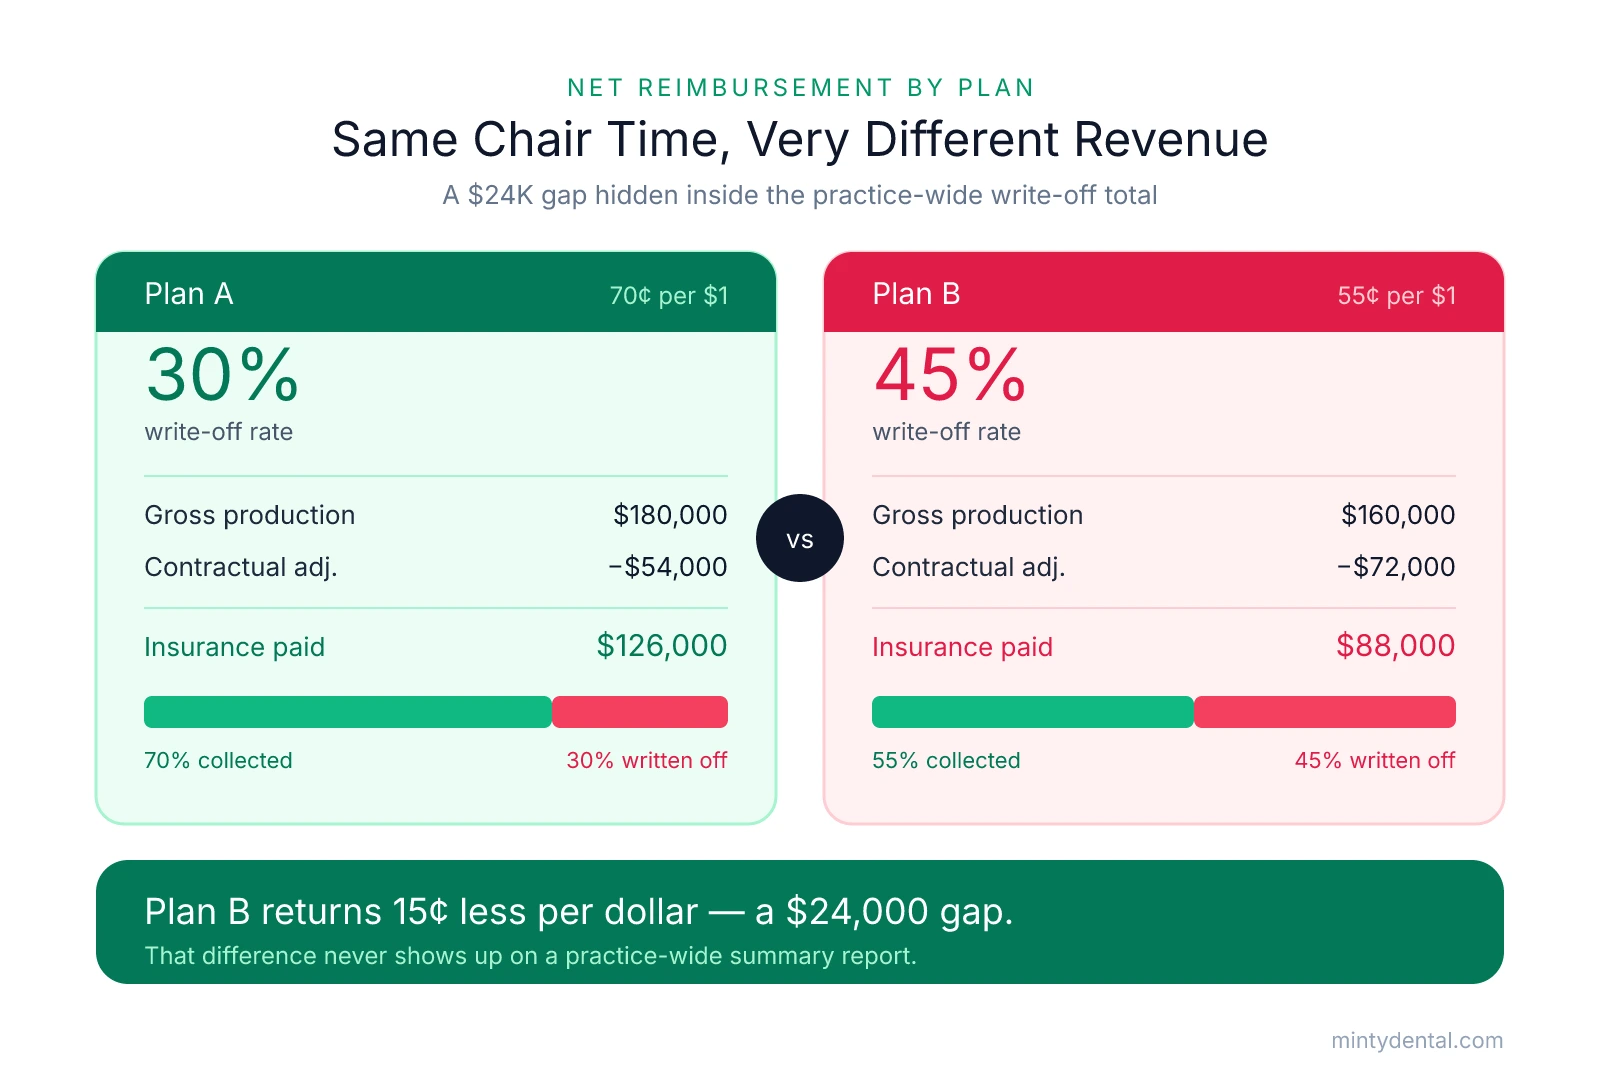
Here's a hypothetical example to illustrate the difference (all numbers are fabricated for illustration only):
| Plan A | Plan B | |
|---|---|---|
| Gross production billed | $180,000 | $160,000 |
| Contractual adjustments | $54,000 | $72,000 |
| Insurance payments collected | $126,000 | $88,000 |
| Write-off rate | 30% | 45% |
| Net reimbursement rate | 70 cents per dollar | 55 cents per dollar |
Both plans occupied similar chair time over the year. But Plan B returned 15 cents less per dollar billed, which on $160K of production works out to a $24,000 gap in net revenue compared to Plan A's rate. That difference never appears in a summary report.
One thing to check before you finalize the numbers: make sure the adjustment codes being captured in the write-off report actually reflect contractual write-offs and not other adjustment types, like courtesy discounts or billing corrections. If your front desk uses a single generic adjustment code for everything, the distinction between a contractual write-off and other adjustments can get muddled, which would overstate or understate what any individual plan is actually costing you.
What you end up with after running both reports is a ranked list of your plans by net reimbursement rate. That list is the starting point for every plan-level decision that follows, whether that's identifying which plan to renegotiate first, which to drop, or which is actually performing better than the practice-wide average suggests.
Reading the Numbers: What a Bad Write-Off Rate Actually Looks Like
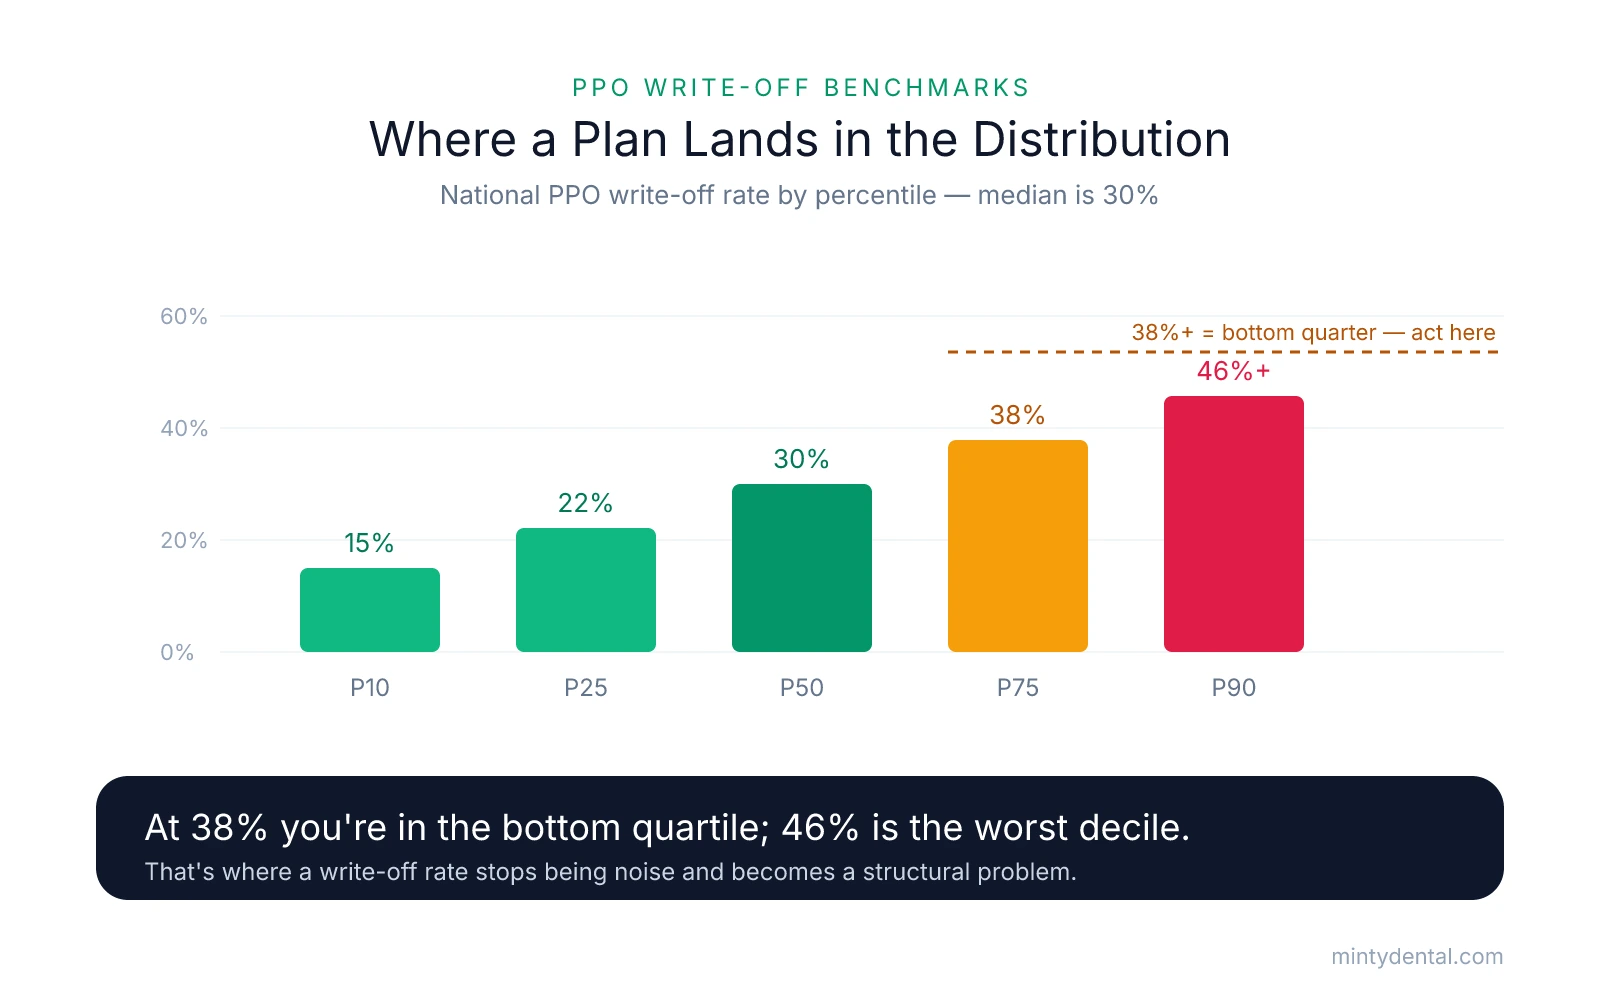
Once you have your per-plan write-off rates in front of you, you need a frame of reference. At the national median, general dental practices write off approximately 28–32% of PPO gross production to contractual adjustments, meaning about 68–72 cents collected per dollar billed. The distribution spreads out from there:
| Percentile | PPO Write-Off Rate |
|---|---|
| P10 | 15% |
| P25 | 22% |
| P50 (median) | 30% |
| P75 | 38% |
| P90 | 46%+ |
If a plan in your mix is running at 38% or above, you're in the bottom quarter of PPO economics for that contract. At 46%, you're in the worst decile. That's the ballpark where the write-off rate stops being a rounding error and starts being a structural problem.
Across common endodontic, periodontic, prosthodontic, and oral surgery procedures, private insurance reimbursement averaged only 66.4–81.1% of submitted fees by procedure in 2014, implying a write-off of 19–34% at the procedure level. The gap between submitted fees and reimbursement widened from 2005 to 2014 across nearly every procedure studied, and that trend has not reversed.
A useful floor comparison: Medicaid FFS averaged 49.8% of private insurance rates for adult dental services in 2024. If a PPO plan in your mix is paying rates that approach Medicaid territory, the benchmark table above is almost beside the point. The more important question is what that chair time costs you relative to what the plan actually returns.
That's the part the write-off rate alone can't tell you. A 45% write-off on a plan that fills open chair time in a practice running 20% vacancy looks very different from a 32% write-off on a plan that's bumping fee-for-service patients out of your schedule. In the first case, the plan is covering overhead that would otherwise go unrecovered. In the second, it's actively displacing revenue you could have collected at full fee. The write-off rate is the same in both scenarios; the economic outcome is not. The comparison that actually matters is net revenue per procedure against the cost to deliver that procedure in your practice.
Two compounding problems can push write-off rates upward even when you haven't changed anything. The first is fee schedule stagnation. Contracted rates in most PPO agreements don't update automatically on any fixed schedule, and carriers have little incentive to raise them without a request. As your UCR fees rise each year, the gap between your billed fee and the contracted rate widens, and your write-off rate climbs without you doing anything.
The second is silent PPO leasing. Carriers frequently lease your discounted rates to other plans you never contracted with, so write-offs start appearing on EOBs from networks you've never heard of, at rates you never agreed to. Both of these mechanisms cause the write-off rate to drift upward over time, quietly, without triggering any alert in your reporting.
That's why the ranked list of plans by write-off rate isn't a one-time exercise. A plan that looked acceptable two years ago may have drifted into the bottom quartile simply because your fees moved and the contracted rate didn't.
What to Do With a Plan That Fails the Test
Once you have a ranked list with write-off rates attached to each plan, you have three realistic options for any plan that lands at or above 38%: renegotiate, drop, or accept it knowingly. Each has a different calculus, and none of them is universally right.
Renegotiate. The write-off report you've already pulled gives you exactly what you need to make a targeted request. Rather than asking for an across-the-board fee increase, go in with the specific procedure codes where the dollar gap is largest. D2740 (porcelain crown) generating a $280 write-off per procedure is a more persuasive argument than "our overall write-off rate is too high." Carriers negotiate fee schedules by code, and a code-level approach to PPO negotiation gives you a concrete number to put in front of a network representative rather than a general complaint. You're asking for a specific adjustment on specific codes, which is a more tractable request than a blanket increase.
Drop the plan. The first question here is not how much you're writing off — you already know that. The question is what percentage of those patients would stay at out-of-network rates or full fee. Roughly 60 to 70% of patients typically remain with the practice when a plan is dropped. Run the number for your specific plan: if 65% of patients stay and the plan was running a 42% write-off rate, you may collect more from fewer patients, because you're no longer discounting every procedure by nearly half. The math doesn't always favor dropping, but it often surprises owners who assume most patients will leave.
If you decide to drop, check your contract before doing anything else. Most PPO agreements require 60 to 90 days' written notice, and the termination has to follow the contract's specific procedure or it may not be recognized by the carrier. Patient communication needs to happen before the effective date, not after.
Accept the plan. Sometimes a plan with a high write-off rate is still the right call to keep. If it's the dominant employer plan in your area and dropping it means losing a substantial patient cohort with no realistic path to replacing them at a better rate, the write-off rate may be the cost of staying accessible to your local market. The same logic applies if the plan is filling open chair time that would otherwise sit idle. A 40% write-off on a procedure that covers your overhead for that hour is better than no production at all. The decision to accept should be intentional, not a default because you haven't gotten around to addressing it. That's a meaningful distinction.
Evaluate every plan at or above the 38% mark one at a time. A blanket policy, dropping all high-write-off plans or keeping all of them, ignores the specifics that actually determine whether dropping or staying generates more revenue. If renegotiation is on the table, understanding what a full transition away from PPO participation involves is worth doing before you make any single-plan decision, since the sequencing matters if more than one plan is in question.
Run the write-off report again in 12 months.
Sources & References
The data and claims in this article are drawn from the following sources. We prioritize government data, peer-reviewed research, and established industry publications to ensure accuracy.
- An Introduction to Dental Benefits— ada.orgIndustry
- Low Reimbursement Rates Top Dentists' Challenges in 2026— theleadmagazine.comNews
- Getting to know the Insurance Carrier Production Report— blog.dentrixenterprise.comIndustry
- An Introduction to Dental Benefits— ada.orgIndustry
- An Introduction to Dental Benefits— ada.orgIndustry
- PPO Write-Off Rate Dental Benchmarks | DSI— www.dentalstrategyinstitute.comIndustry
See Where Your PPO Fees Stand by Area
You have identified which plans are pulling down your net reimbursement per procedure. A Rate Check shows how your current fees compare to what group fee schedules pay for the same procedures in your area.