Gross vs. Net Collection Rate: Which One to Track

Co-Founder, Minty Dental

In Summary
- Gross collection rate divides total payments by total production at your full billed fees; net collection rate divides the same payments by what you were actually entitled to collect after PPO write-offs.
- Contractual adjustments (the CO-45 line on an EOB) are the difference between your billed fee and the payer's allowed amount. You agreed to waive this amount when you signed the PPO contract, so it was never collectible revenue.
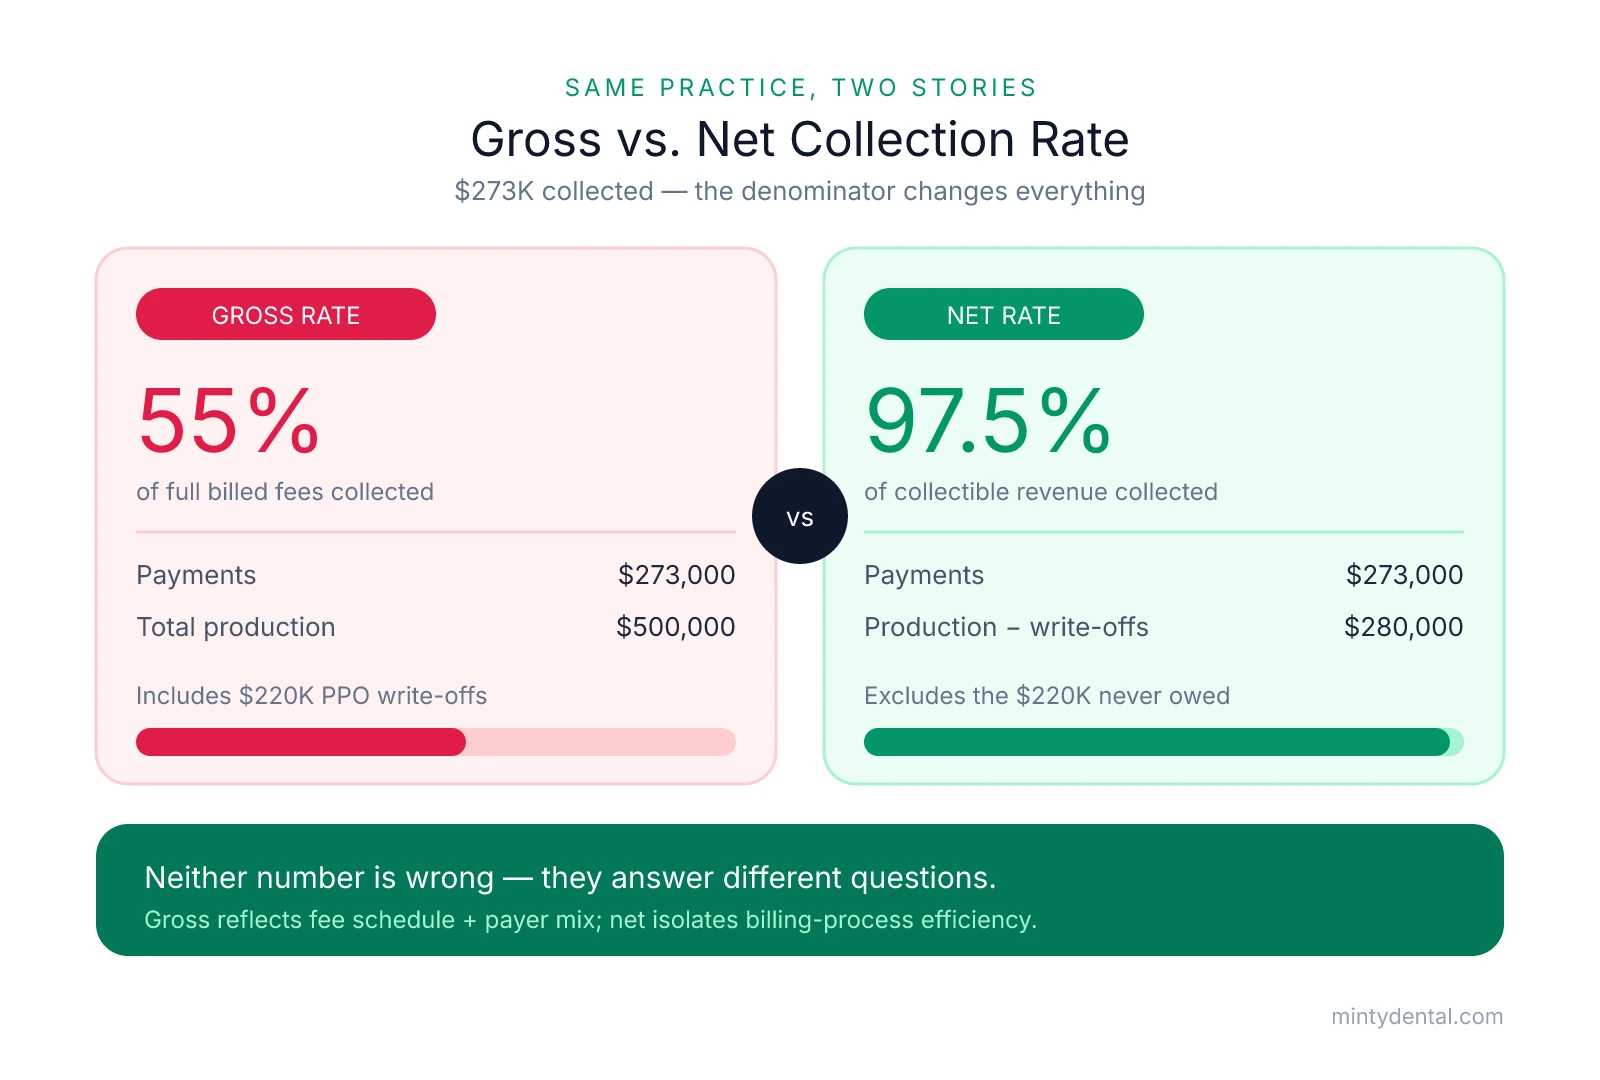
- The same practice collecting $273K on $500K billed with $220K in PPO write-offs produces a 55% gross rate and a 97.5% net rate. Neither number is wrong; they answer different questions.
- Industry benchmarks of 95 to 98% reference net collection rate. Comparing your gross rate to those targets creates false concern about billing performance that may not exist.
- Net collection rate isolates billing-process efficiency; gross collection rate reflects the combined effect of your fee schedule and your payer mix.
Gross and Net Collection Rate Measure Different Denominators — and That Changes Everything
If you've ever looked at your PMS dashboard and seen a collection rate around 55% or 60%, then opened a consultant report showing a 97% benchmark and felt like you were running a completely different practice, you weren't misreading anything. Those two numbers almost certainly measure different things. The formulas share a numerator but use completely different denominators, and that distinction determines what question each one actually answers.
| Metric | Formula | Denominator includes | Answers |
|---|---|---|---|
| Gross Collection Rate | Total Payments / Total Production x 100 | Full billed fees, including PPO write-offs | What % of your full fee schedule did you collect? |
| Net Collection Rate | Total Payments / (Total Production - Contractual Adjustments) x 100 | Only revenue you were entitled to collect | What % of collectible revenue actually came in? |
What "contractual adjustments" means in practice
When your EOB arrives for a crown you billed at $1,400 and the payer's allowed amount is $900, there's a $500 difference. That $500 appears on the EOB as a CO-45 adjustment, which is the standard CARC code for a contractual discount between your billed fee and the payer's negotiated rate. Your practice writes it off because you agreed to accept the lower fee when you signed the PPO contract. That $500 was never going to come in. It shouldn't count against your ability to collect what you were actually owed.
In a PPO-heavy practice, these write-offs add up fast. That's the entire reason gross rate and net rate diverge so sharply.
A worked example
Take a hypothetical practice with the following numbers for a given period:
- Total production (at full billed fees): $500,000
- Contractual PPO adjustments: $220,000
- Total payments collected: $273,000
Gross collection rate: $273,000 / $500,000 = 55%
Net collection rate: $273,000 / ($500,000 - $220,000) = $273,000 / $280,000 = 97.5%
Same practice. Same collected dollars. Two completely different stories. The gross rate looks like a practice with a serious revenue problem. The net rate shows a practice collecting almost everything it was contractually entitled to receive. The gross figure isn't wrong; it's just measuring the gap between your full fee schedule and what PPO contracts actually pay, which is a contract and payer-mix question, not a billing-performance question.
Why comparing to the wrong benchmark matters
Most industry benchmarks target net collection rates between 95% and 98%. If you're running a PPO-heavy practice and comparing your 60% gross rate to that target, you're going to conclude your billing team is leaving enormous amounts of money on the table. That conclusion might be completely wrong. It might also mask a real net collection problem if the two numbers never get separated in the first place. If your net collection rate has started slipping and you want to trace where the revenue is actually leaking, that's a different diagnostic process, one that starts with identifying which part of the cycle is losing money rather than reacting to the gross figure alone.
Why Gross Collection Rate Misleads in a PPO Practice — and What It's Actually Useful For
The core problem with gross collection rate as a billing diagnostic is that it folds two completely independent variables into a single number. One is a contract decision: how much your billed fees exceed what your PPO plans will pay. The other is a process outcome: how well your team collects everything the payer owes once a claim is processed. Those two things have nothing to do with each other operationally, but gross rate treats them as if they do.
Most dental practices believe their revenue cycle is functioning well because their collections appear healthy, but they are measuring the wrong number. A practice can have a 75% gross collection rate and a 98% net collection rate simultaneously, and both numbers are accurate. The 75% gross rate reflects the size of the PPO discount sitting between the billed fee and the allowed amount. The 98% net rate reflects how much of the allowed amount actually came in. The first number tells you something about your contracts. The second tells you whether your billing team is doing its job. Conflating them produces a figure that answers neither question cleanly.
The practical consequence is that practices carrying a heavy PPO load will always show a depressed gross rate even when billing is running well. If that number is what shows up in a dashboard report or gets handed to a consultant, it looks like a problem that isn't there. And if no one separates it from the net rate, an actual billing problem can hide behind a gross rate that has been low for so long it no longer draws attention.
Where gross rate does legitimate work
That said, gross collection rate isn't useless. It just answers a different set of questions.
The most practical use is tracking payer mix over time. If your gross rate falls from 82% to 76% over 18 months while your net rate stays flat around 97%, that gap is telling you something: a larger share of your production is now flowing through PPO contracts. Billing hasn't changed. Your team is still collecting nearly everything they're entitled to collect. But the composition of your patient base has shifted, and gross rate picked it up before it showed anywhere else. That's a strategic signal worth paying attention to, particularly if you've been accepting new PPO plans during the same period. Tracking your payer mix by insurance plan alongside gross rate gives you the fuller picture of where that shift is coming from.
Gross rate is also the right metric when you're evaluating a fee-for-service transition. As PPO volume drops and more patients pay at your full billed fees, the write-off volume shrinks and gross rate should rise toward net rate. The narrowing gap between them is exactly what a PPO-to-fee-for-service transition should produce over time. If gross rate isn't climbing as PPO volume falls, the transition isn't working the way it should.
There's also a fee schedule benchmarking use case. If your gross rate is unusually high, sitting close to your net rate, it may indicate your billed fees are already near or below payer contracted amounts. That leaves no negotiating room and no buffer when a carrier updates its fee schedule downward. A wide gap between gross and net is uncomfortable to look at, but a very narrow one deserves its own kind of scrutiny.
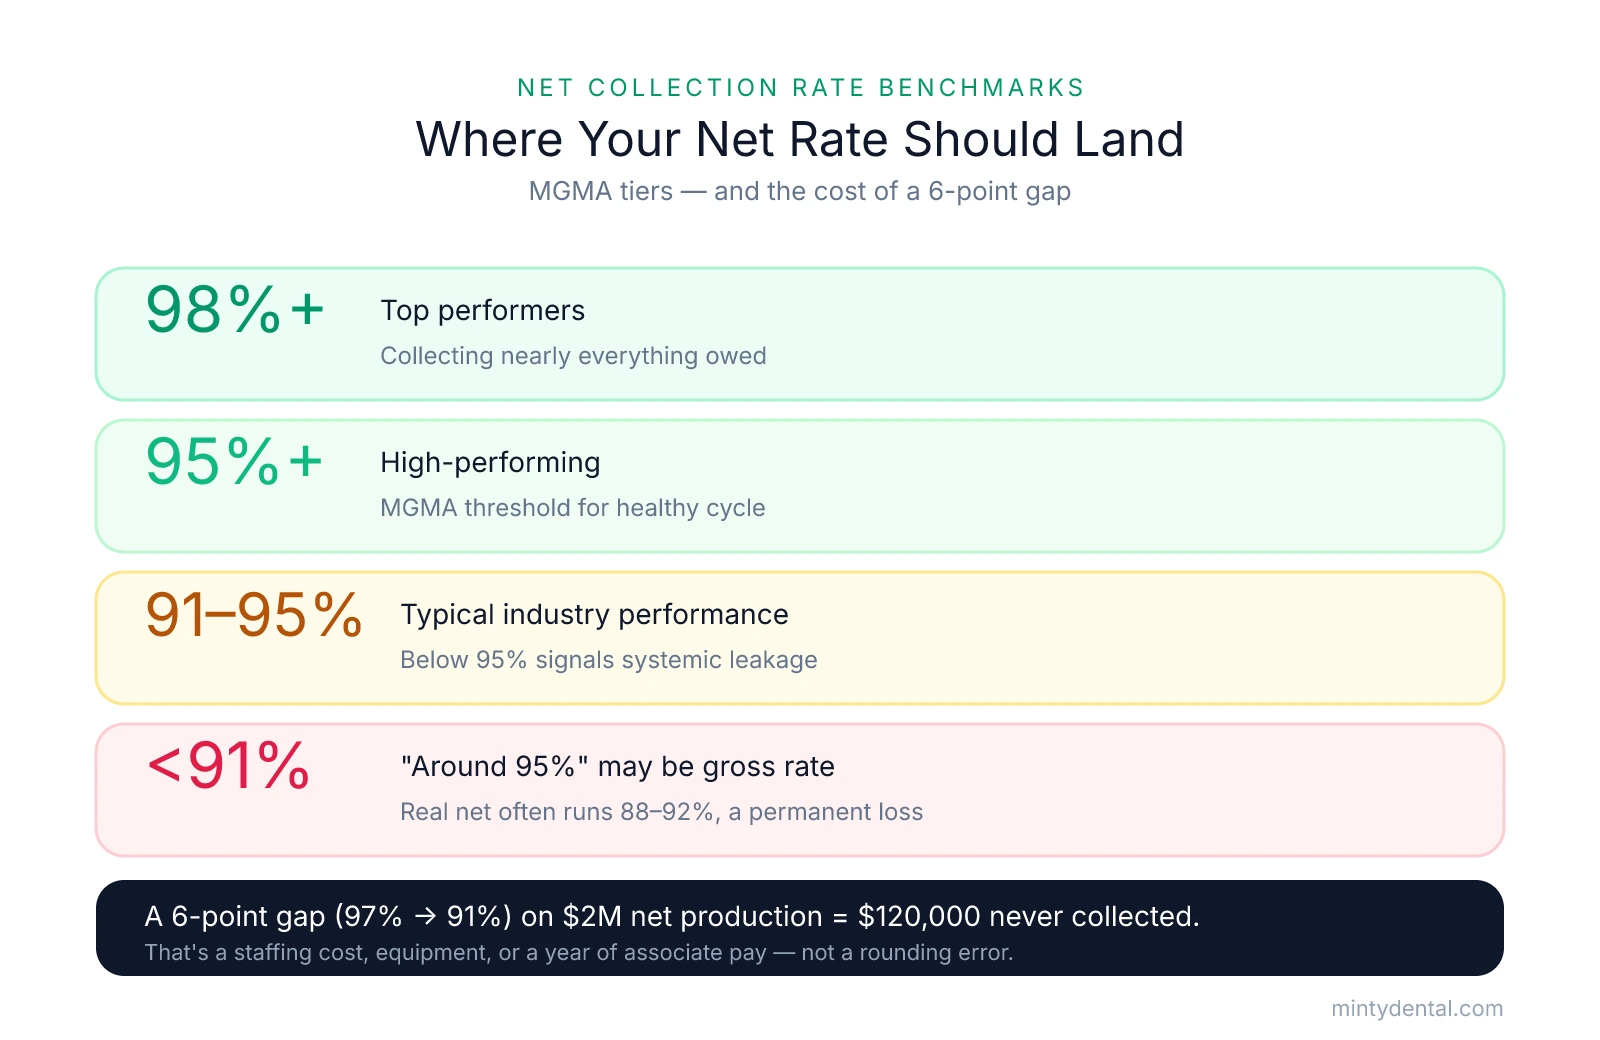
The mistake most practices make is treating gross rate as the primary monthly performance metric. Many practices that believe they collect "around 95%" are tracking gross rate, which means their actual net collection rate is likely running closer to 88% to 92%. The difference is permanent revenue loss on every dollar of collectible production, quietly absorbed as a normal cost of doing business.
What a Drop in Net Collection Rate Actually Signals
Because the net rate's denominator already excludes contractual write-offs, the formula is measuring something specific: how much of what you were entitled to collect actually came in. That means when the number drops, you're not looking at a pricing or payer-mix problem. You're looking at a process failure somewhere in the revenue cycle. The question is where.
There are four places to check first.
Adjustment code miscategorization. This one is counterintuitive because it makes your net rate look better, not worse, but it's worth understanding first because it corrupts everything else. If your billing team is posting non-contractual write-offs, timely filing failures, internal courtesy adjustments, uncollected patient balances eventually written off, into the contractual adjustment bucket, those amounts get subtracted from the denominator along with legitimate PPO discounts. The denominator shrinks, the rate rises, and you have no idea how much revenue you're actually losing. The write-off percentage on your adjustment ledger should break down by adjustment type. If it doesn't, the net rate figure you're monitoring may be meaningfully overstated.
Unworked claim denials. A denied claim isn't a write-off yet, but it becomes one if nobody works it. Once a claim ages past the payer's timely filing window, the opportunity to collect closes permanently. Those expired claims post as write-offs and pull the net rate down. Industry guidance targets a denial rate below 5%; practices running higher than that are almost always seeing it show up in net rate eventually. The lag can be 60 to 90 days, so a denial management problem that started in Q1 may not appear in net rate until Q2. The article on claim denial rates covers how to find which codes and payers are driving the volume.
Patient balance collection failures. Copays and deductibles that don't get collected at the time of service have a way of never getting collected at all. When they're eventually written off, they're non-contractual write-offs, and they should appear as such in your ledger. Practices that struggle to collect at the front desk tend to see this as a steady drag on net rate, often without connecting it to the checkout process.
Credentialing lapses. If a provider's credentialing with a payer lapses or was never completed correctly, claims submitted under that provider process out-of-network or deny entirely. The resulting write-offs look like billing errors in the adjustment ledger, but they trace back to a credentialing gap. This is particularly common when a practice adds an associate and the credentialing timeline falls behind the associate's start date.
What the numbers mean in practice
The MGMA benchmark puts a high-performing net collection rate above 95%, with top performers at 98% or above. The 91% to 95% range reflects typical industry performance, and anything below 95% signals systemic leakage worth investigating. On a hypothetical practice with $2 million in net production (after contractual write-offs), a 6-point gap between 97% and 91% is $120,000 in earned revenue that was never collected. That's not a rounding error; it's a staffing cost, a piece of equipment, or a year of associate compensation.
Running Both Rates Monthly — and Knowing Which One to Act On
Net collection rate is your primary billing-performance KPI, so track it monthly on a rolling 12-month basis rather than reacting to any single month. Payments received in a given month often relate to production completed 30 to 60 days earlier, so a one-month snapshot carries timing noise that a rolling figure smooths out. Net collection rate is the best indicator of your practice's true revenue cycle health, precisely because it strips out what was never collectible. Gross collection rate is a strategic signal, not a billing diagnostic. Check it quarterly and use it to watch for payer mix drift, not to evaluate whether your team is doing its job.
To pull the inputs from your PMS, use the same date range for all three figures: total production at billed fees, total contractual adjustments posted from EOBs, and total payments received, while verifying that non-contractual write-offs have their own distinct adjustment codes.
If net rate drops more than 2 points from your rolling average, start with the adjustment ledger and the denial report before assuming the billing team has a problem. A sudden denominator change from miscoded adjustments can move the rate more than a real collections failure can. If the ledger looks clean, move to denial aging. By contrast, if gross rate drops while net rate holds steady, the billing process is fine and PPO volume is expanding; check your payer mix by insurance plan to see which contracts are driving the shift.
If both rates drop together, the problem is upstream of payer mix and billing process. Look at patient balance collection first, then credentialing. A front desk that isn't collecting copays and deductibles at checkout generates non-contractual write-offs that pull net rate down steadily. A credentialing lapse affecting multiple payers will show up as denied claims across carriers and hit both rates at once.
One refinement worth adding to your monthly review: run net collection rate by payer, not just in aggregate. A single underperforming carrier can drag on the overall number while everything else runs at 97% or 98%, and the aggregate figure will never surface it. Payer-level net rates are also where credentialing problems show up first, since claims from an uncredentialed or lapsed provider will deny or downgrade consistently within that payer's data before the pattern becomes visible anywhere else. Pairing this with AR days by payer gives you a complete picture of where revenue is slowing down and why. Both metrics together are a more useful monitoring set than either one alone, and tracking them alongside your other monthly KPIs is what keeps a revenue problem from becoming invisible until it's large enough to feel.
Sources & References
The data and claims in this article are drawn from the following sources. We prioritize government data, peer-reviewed research, and established industry publications to ensure accuracy.
- How to Calculate the Net Collection Rate for a Dental Practice— www.cecomputech.comIndustry
- Dental Collection Rate: What's Good (95%+) and How ... - Zeldent— zeldent.comIndustry
- The 7 revenue cycle gaps most dental practices don't know ...— www.dentistryiq.comNews
- Net Collection Rate vs Gross Collection Rate: 2026 Guide— www.aspectbillingsolutions.comIndustry
- Net Collection Rate (NCR Calculator) for Medical Practices— www.medusind.comIndustry
- Net collection and gross collection: simple truths you need to ...— rivethealth.comIndustry
See Where Your PPO Fees Stand Before Tracking More Numbers
Net collection rate tells you how well your billing is working, but the fee schedules behind your write-offs shape what you can collect in the first place. A Rate Check shows where your contracted fees sit for your area and what group fee schedules could mean for your schedule.